Categories
How do you do research? Visual working

Visual interviewing

I increasingly use diagrams, drawings and infographics when I interview someone. Since corona, I often interview digitally. At first I found this very inconvenient and impersonal, but I also discovered the benefits. Precisely because it is digital you can very easily draw together and organize information schematically.

In this blog some examples of how I approach visual interviewing and some tips for getting started yourself. I think it would be fun to organize a workshop or meet-up about this sometime, so I’d love to hear if there’s enthusiasm for that.

Drawing together

“I can’t draw at all” is the first sentence that rolls out of many people when I introduce this method. That changes when we get down to business and the interviewee loosens up and finds it easier and easier to tell and participate. And at the end, “now it’s much clearer for myself, too.”

I call it visual interviewing, drawing together, schematic conversation, picture talking… Think of a nice name. It means that as we talk, we directly visualize how things fit together. This can be done, for example, by making a mind map together, a timeline or some other useful arrangement. During the conversation, you put all the information directly in the right place, which helps both of you get to the point and immediately see if the story is complete.

And yes, you may also just use text while drawing.

A few examples

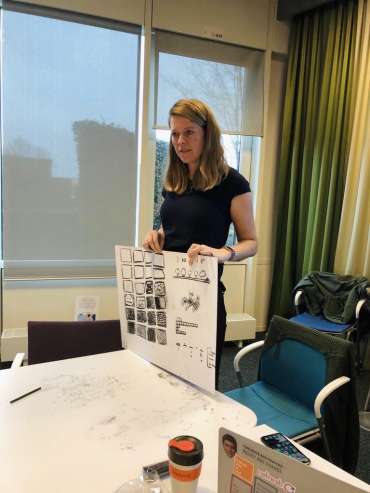
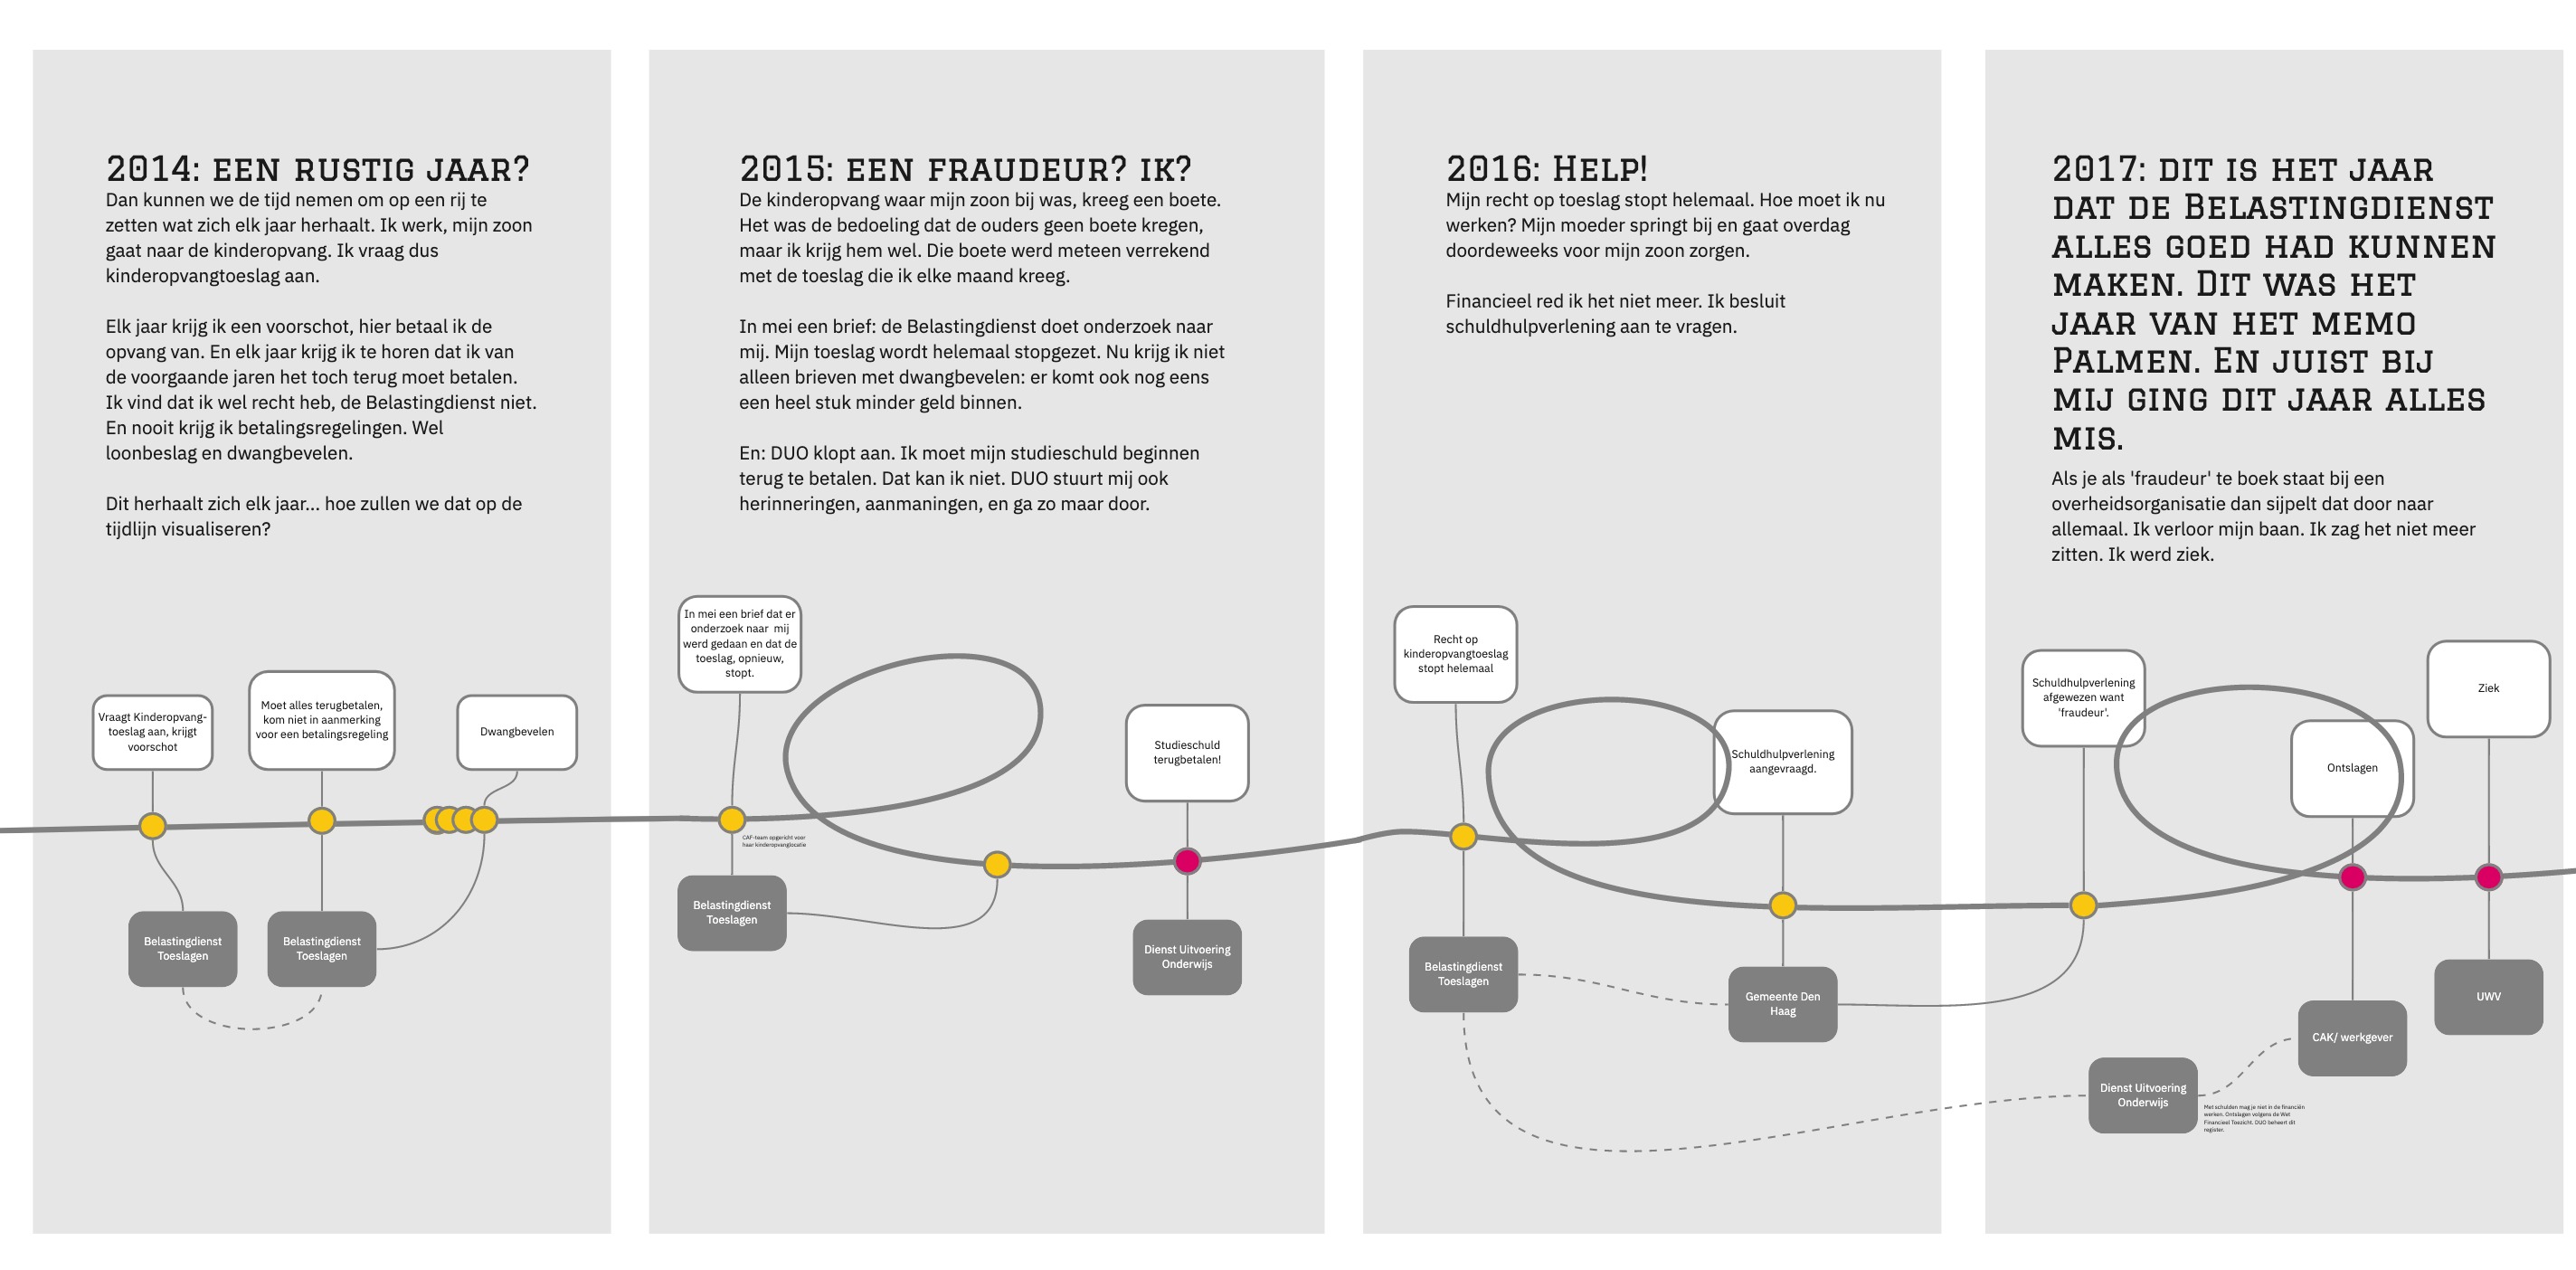
Janet Ramesar and I created a timeline together. That one went back ten years to the present. On the timeline, we posted her experiences with child care subsidies. You could see it getting more and more complicated over time. By lining it up like that, you saw cause and effect very clearly. It gave us a foothold to broadly capture the story in a short period of time. We created the entire timeline in a 1-hour zoom session. Janet told, I shared my screen and posted what she told directly on the timeline. If I misplaced it, she corrected me: ‘no, that should be first. That one should be more to the right’. It gave us both something to hold on to.

A snippet from the timeline Janet and I created together about her experiences with the child care subsidy.

I later used the timeline format myself when I charted a month out of my relationship with the government. And I applied it in a project for Werk aan Uitvoering where, together with Maureen Hermeling, I interviewed someone from Loket Geldzaken of the Municipality of The Hague (on my blog I called him Puzzler Patrick). The three of us thus mapped out complex case histories involving debt.

A snippet from the timeline of Puzzler Patrick and Mr. N.

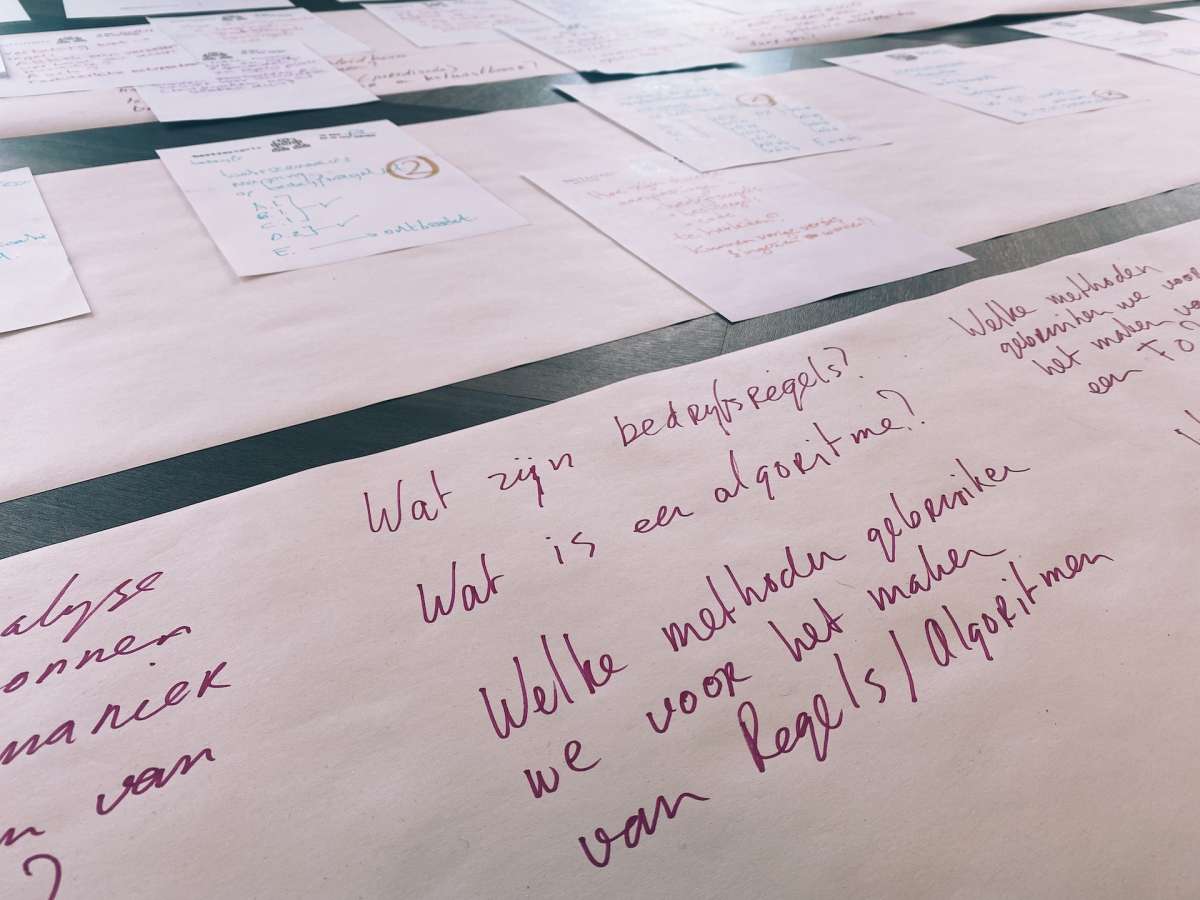
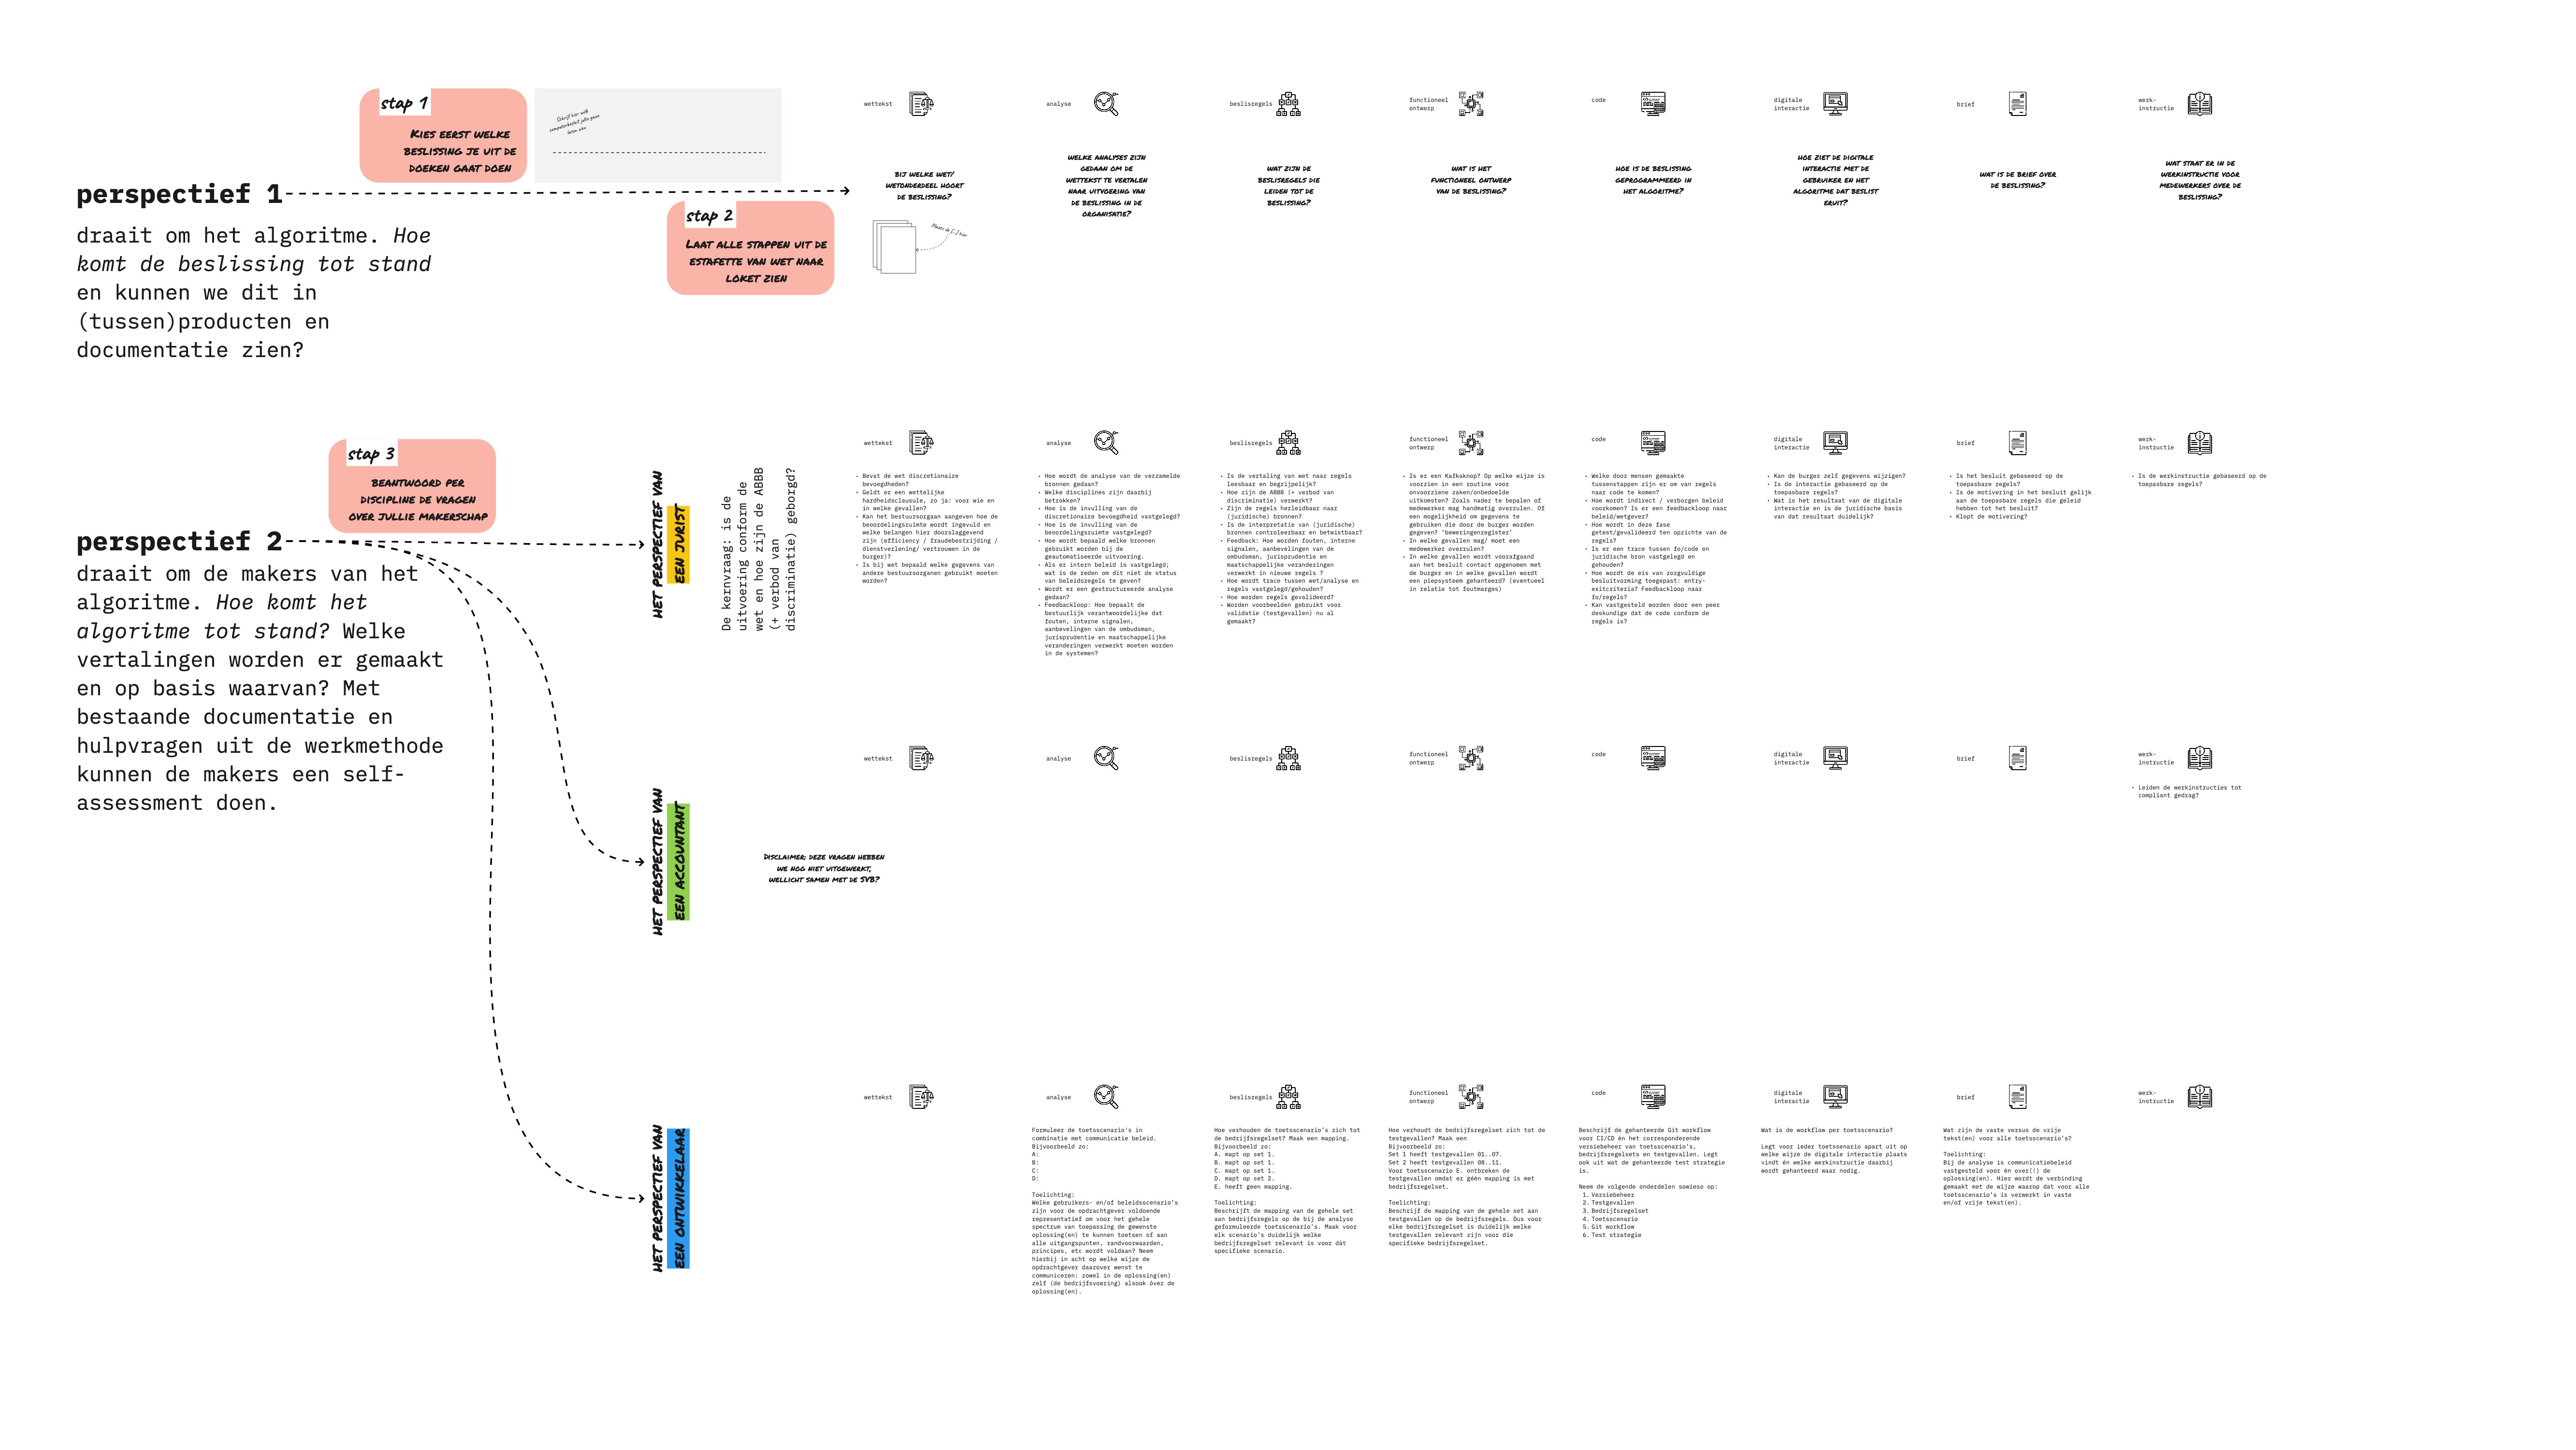
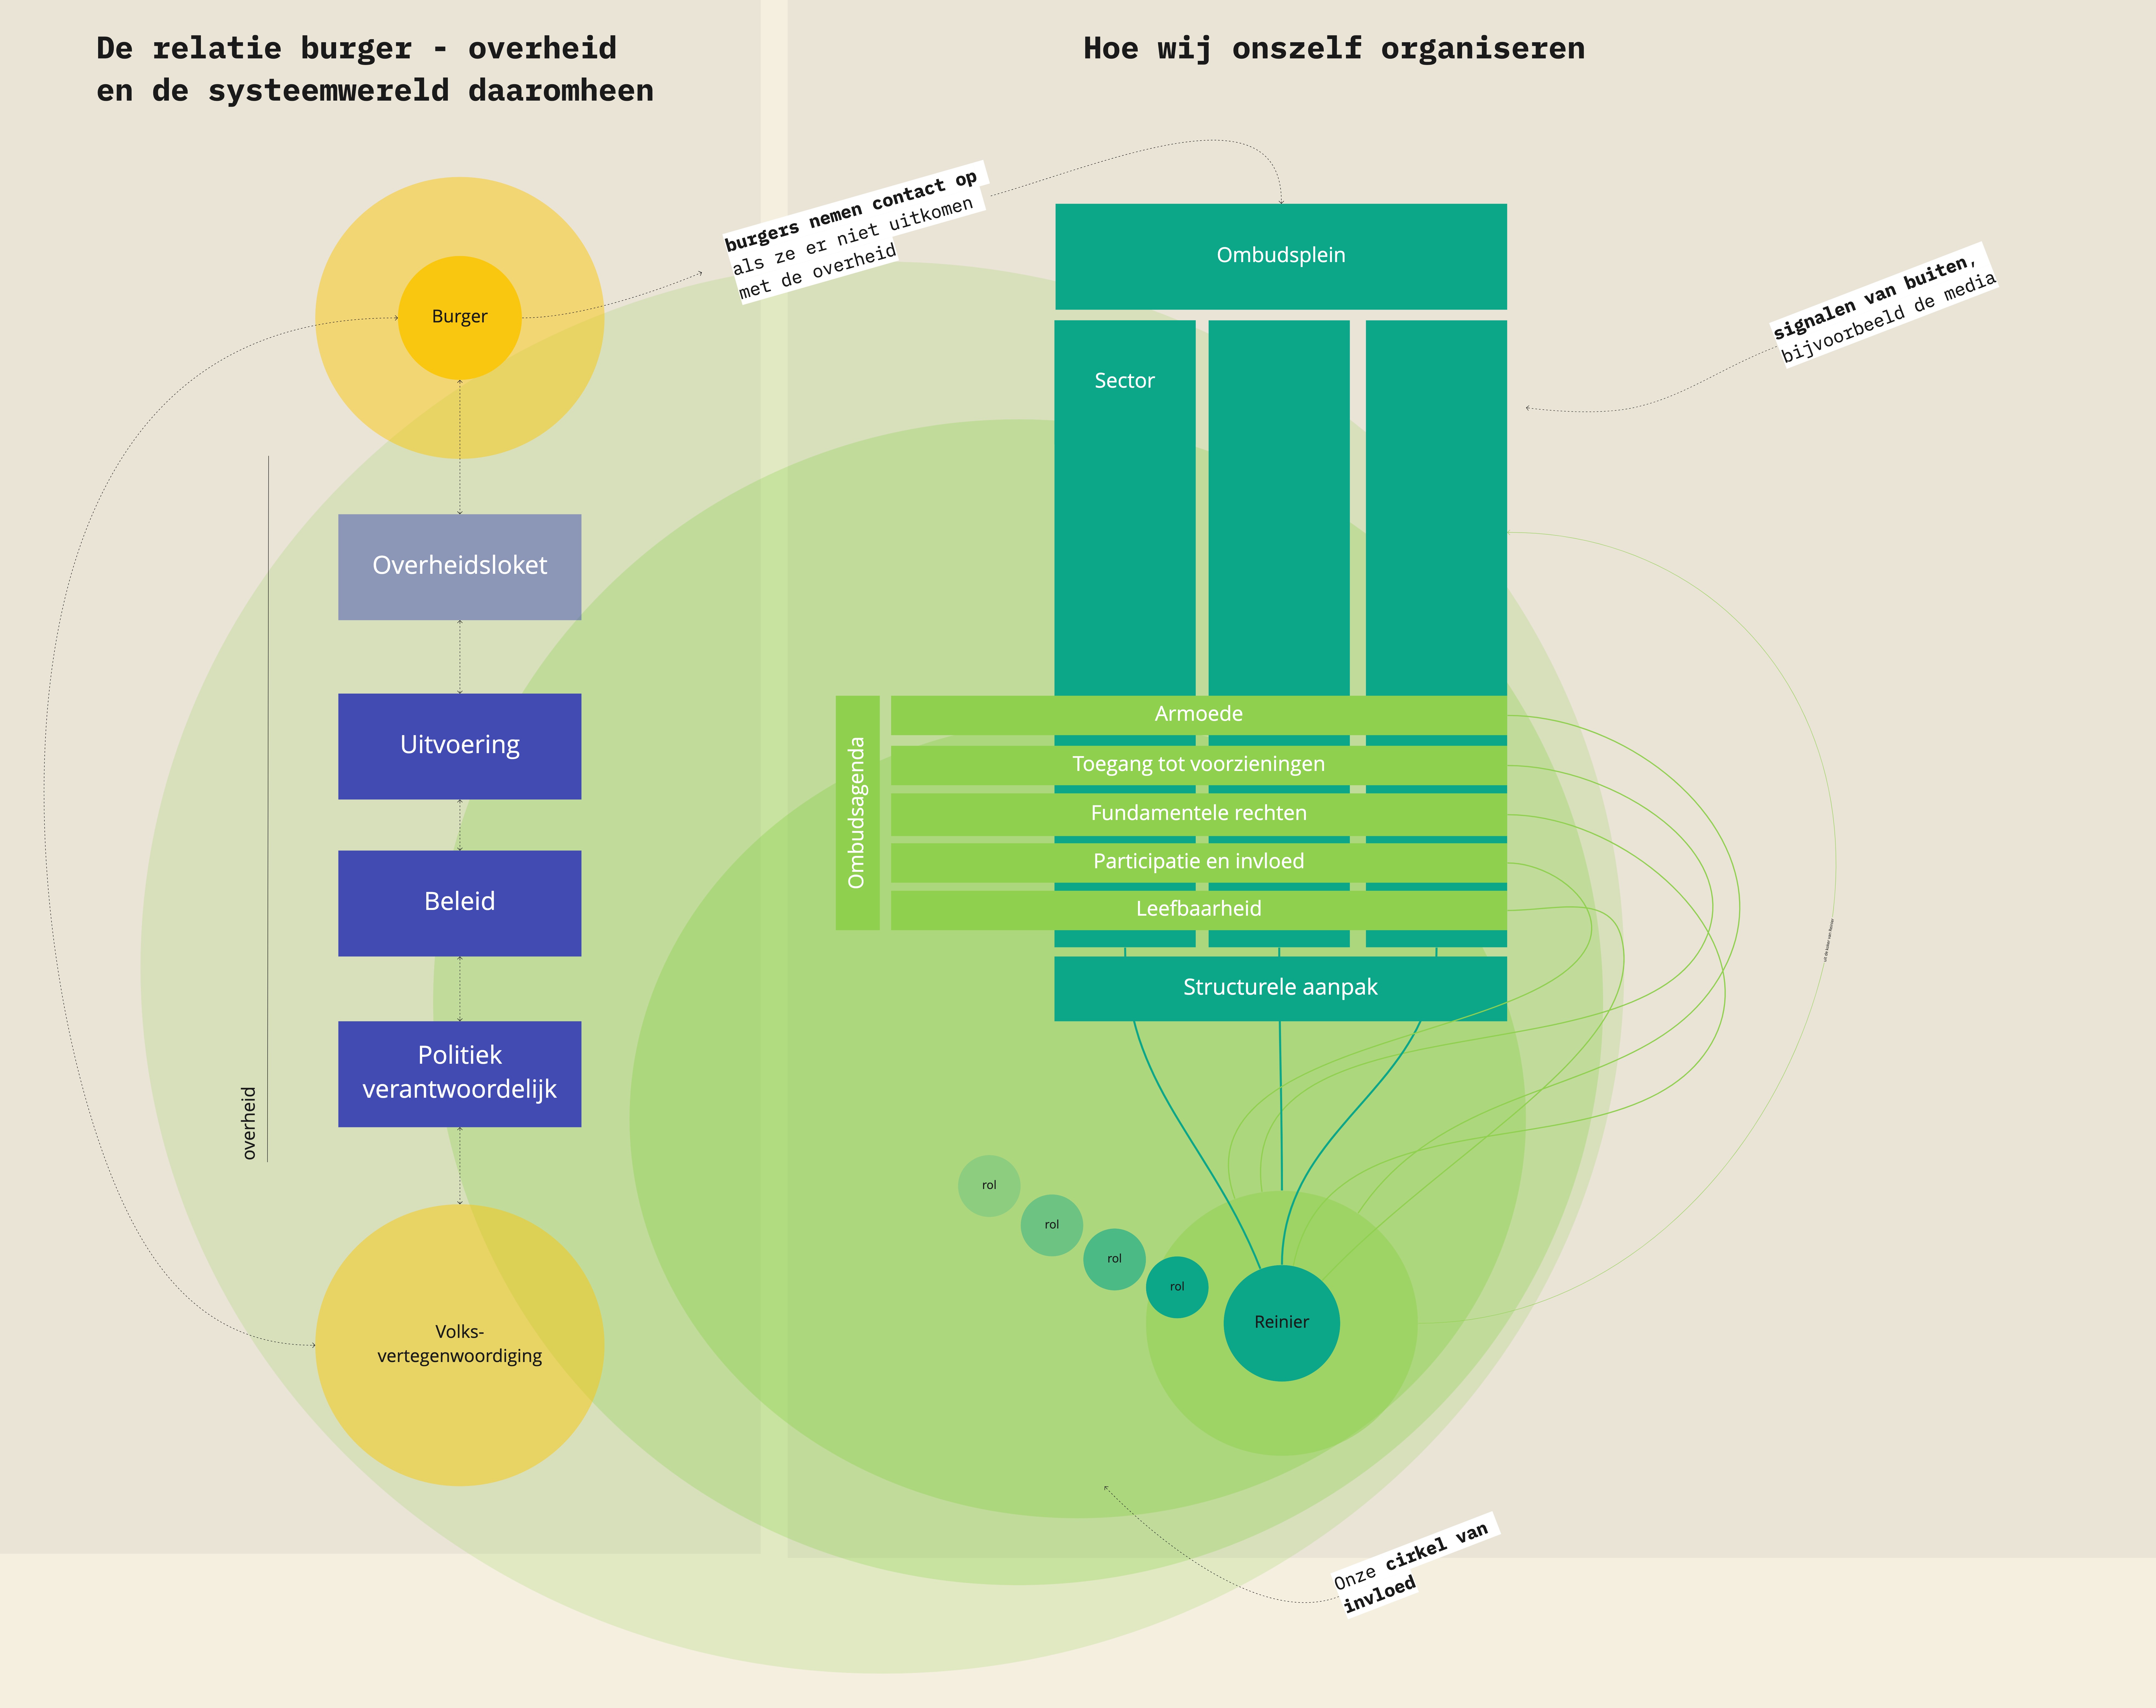
At the Ombudsman, during a series of interviews with colleagues, I used not a timeline but a drawing of the organization. The key question was “how should we organize our own activities to have a greater impact on the government?” In each interview, we drew together a new picture of our ideal organization. While making that drawing, I kept asking why-questions. What I learned from those conversations I described in the blog about a professional listening standard. This is the basic drawing I used as a start for the conversations (i.e., before everyone started shuffling around with it and making a new drawing):

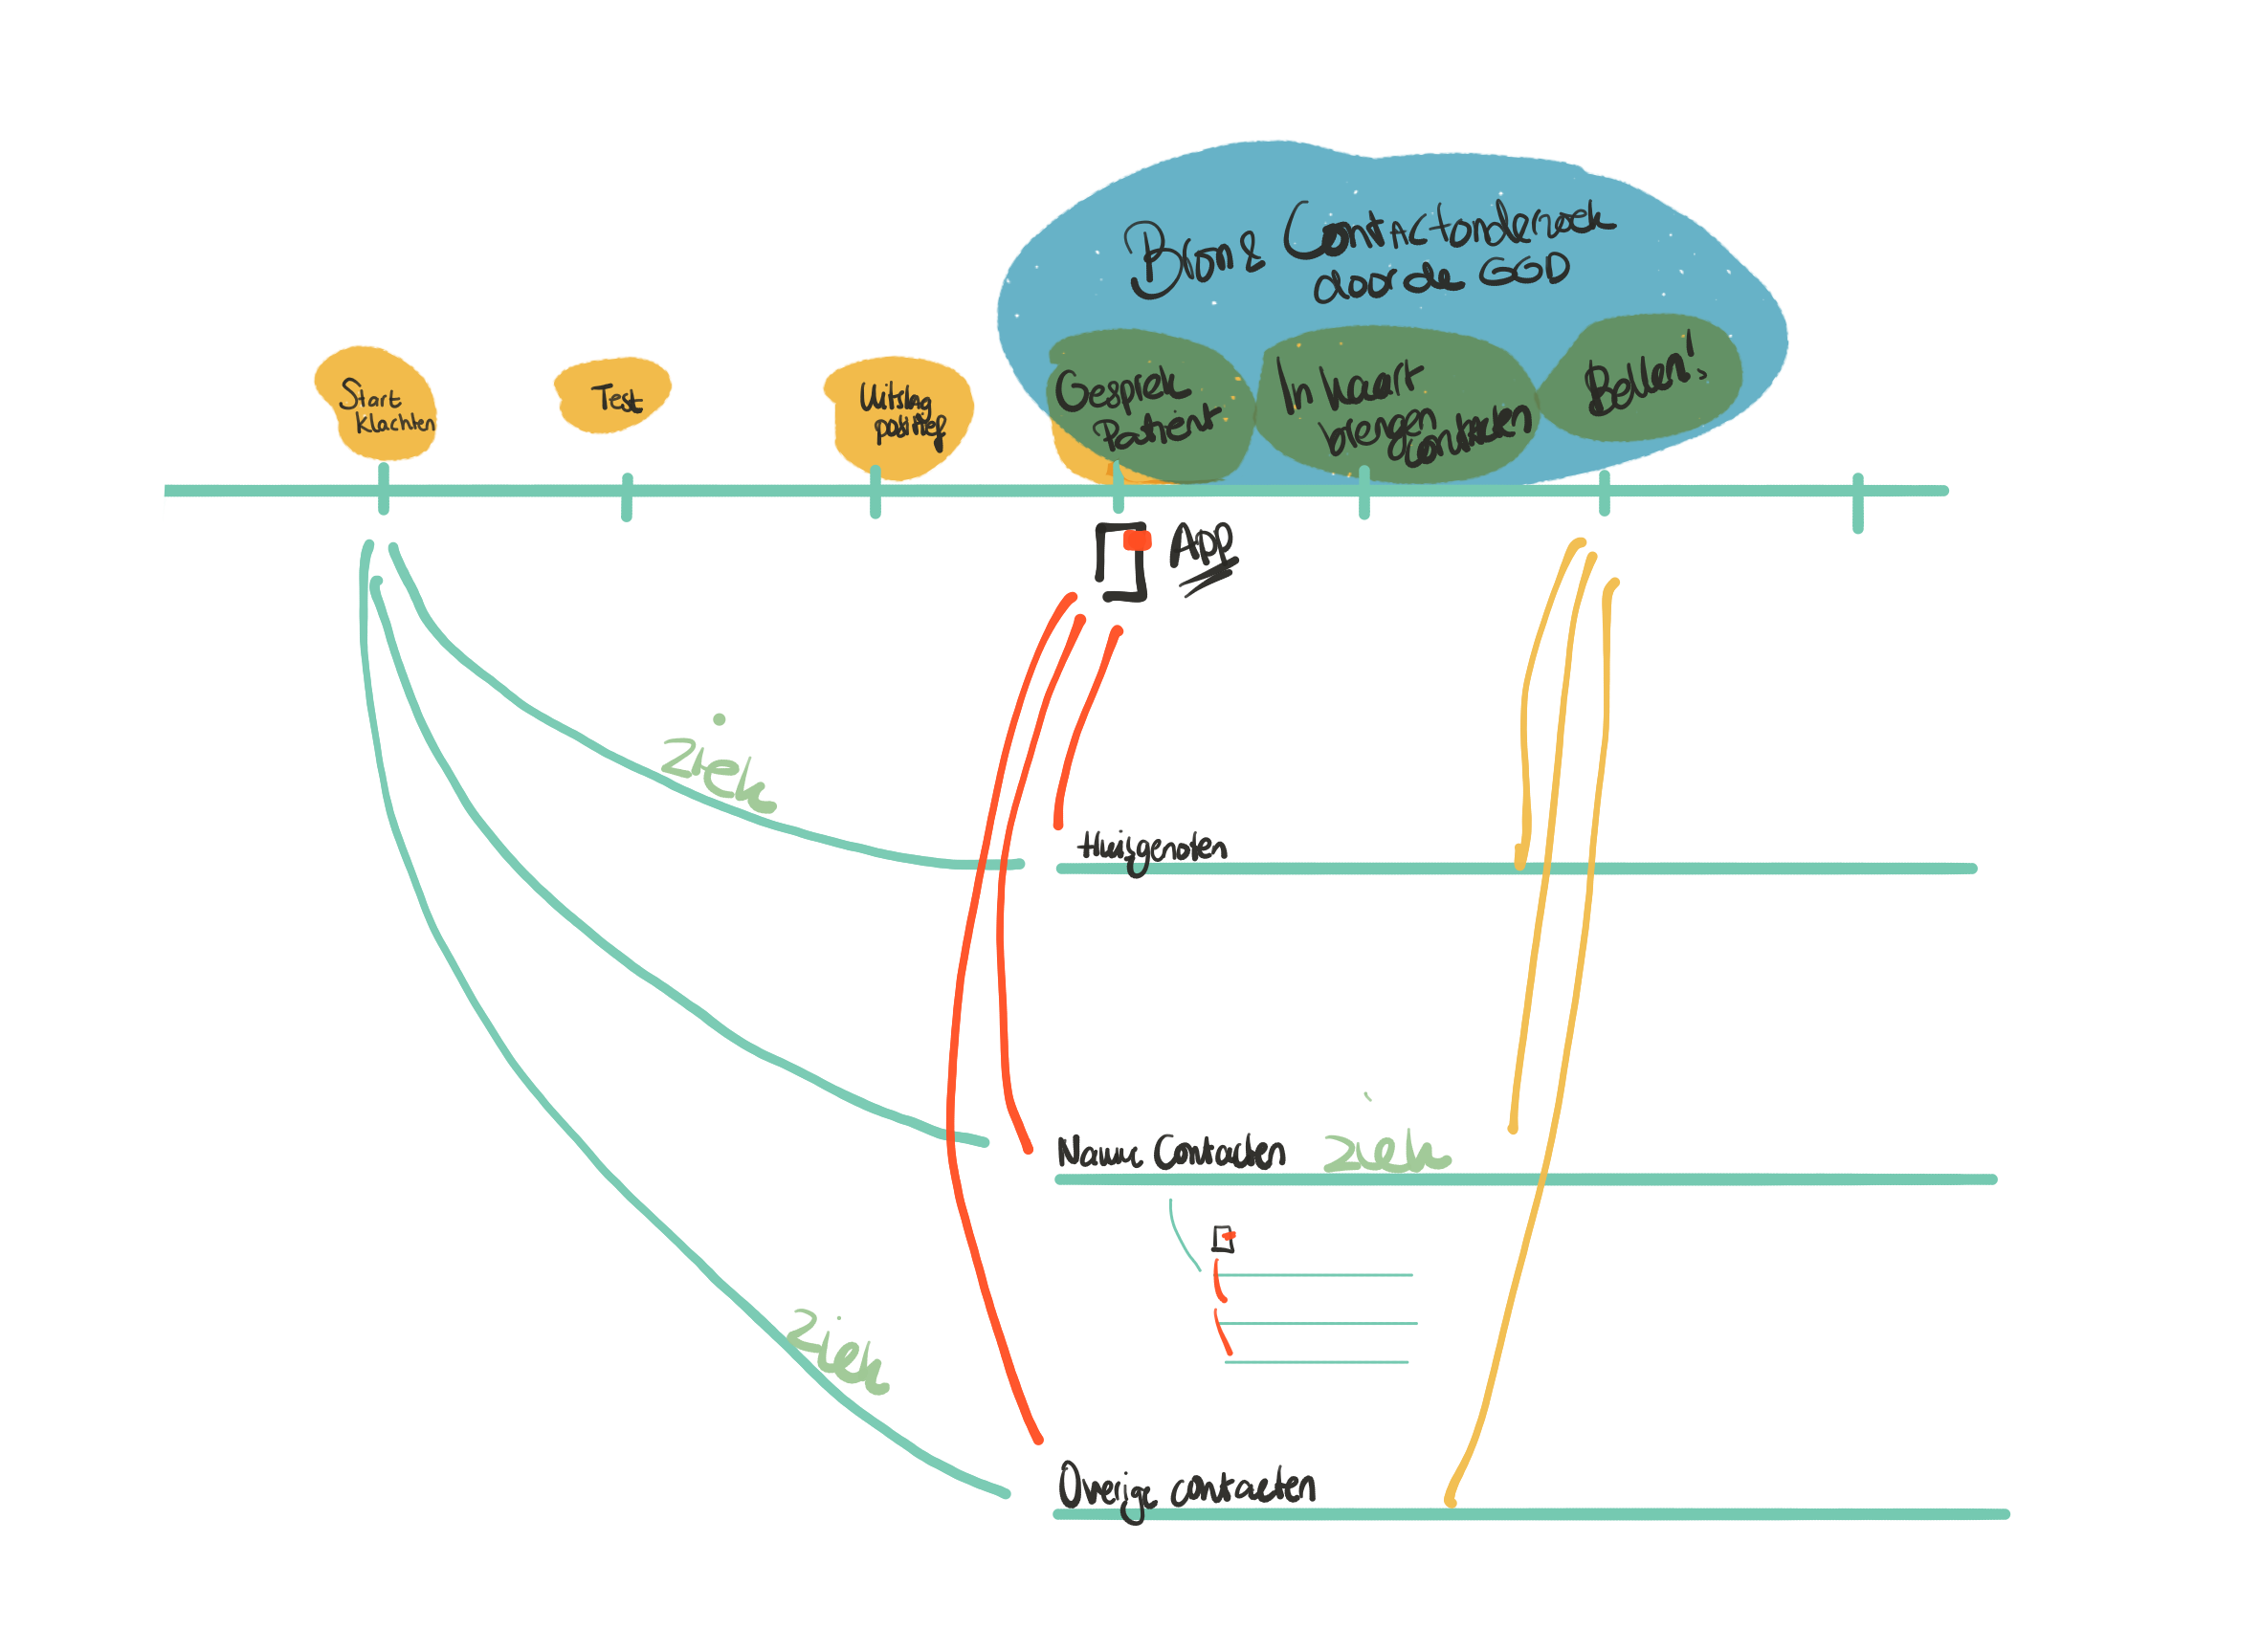
At the beginning of the corona crisis, I got to work for a while with the team that made the corona apps at the Ministry of Health. From Jasper, my husband I had just received an Ipad at that time. I took it along on my visits to the local health organizations (GGD) and outlined with the staff the source and contact tracing and the bottlenecks they experienced. For example, we made these kinds of sketches:

Last example, also with the Ombudsman. In a short brainstorm about signals and complaints as input for research topics, we drew them so you could immediately see the extent of the signals and the overlap with the rest of the topics. This was a first sketch that we could develop later.

Why it works

Drawing together just works nicely. Even in on-site conversations, it’s easy to grab a flipchart: “Shall I draw it out?” and the confusion of speech disappears like snow in the sun.

Digitally, it can be done just as easily. You share your screen, you draw how you envision it, and the other person can immediately respond, “no, you have it all wrong, it should be just like this.”

Creating together means organizing and structuring the story together. It is immediately tangible. You can see it before you. You catch the words in focus before they slip away.

The input is the output. You have the basis for the result and documentation ready immediately after the interview. After talking with Janet, I only needed an extra hour or so myself to make everything neat and write out the keywords. After a check from her, it was finished.

Talking digitally is much less impersonal this way. You are working together. You don’t necessarily have to see each other at all, because you share your story equally and are creative together. That activates even though you are both sitting behind a remote screen. And as an added bonus, you won’t have to type out another stack of post-its or flip charts after the event.

This is what you need

  • a digital drawing tool. I use Miro, but you can also, for example, connect your Ipad to your laptop, draw along and share your screen. Or use another digital tool, there are plenty of them.
  • a basic architecture. Think about how you will set it up in advance. Are you creating a timeline? A schematic of the organization? A mind map of questions and answers? Or something else? In Miro, you have handy ready-made templates that you can use.
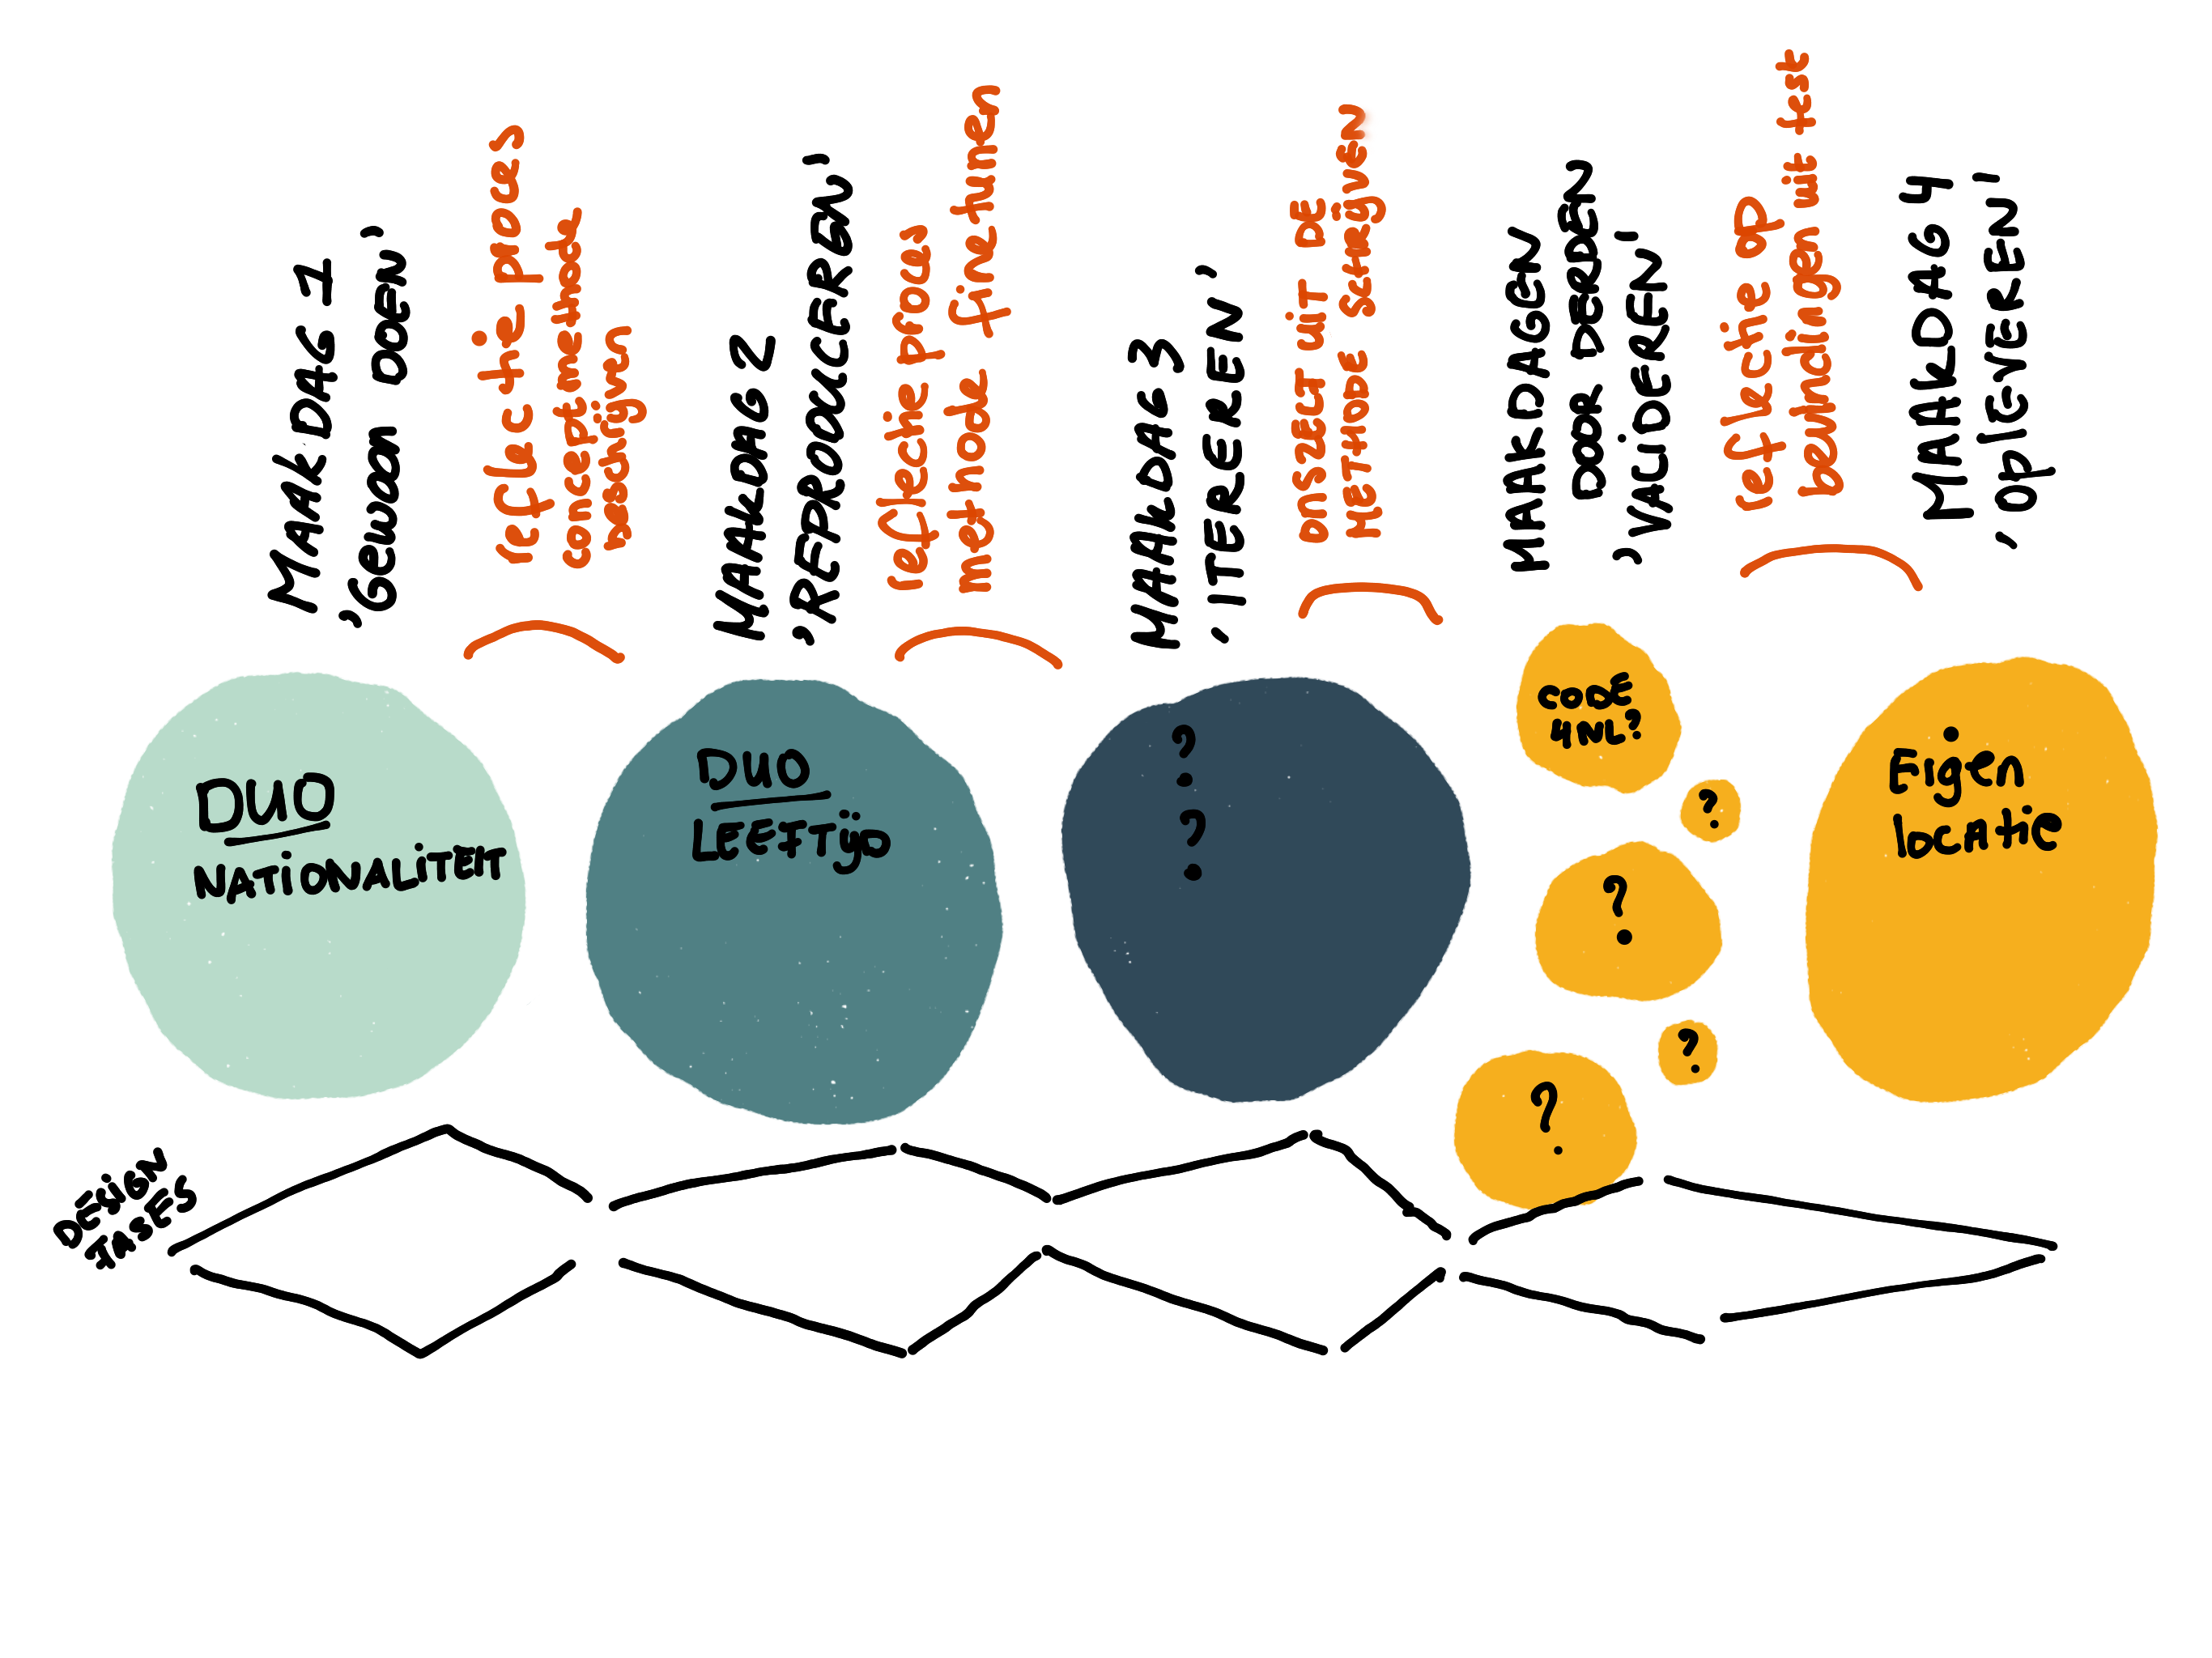
  • Skills to sketch visualization. It doesn’t have to be perfect right away. Thinking out loud “hmm how shall I portray this” is fine. The other person then also helps, and you give the other person a chance to make together. In a master class taught by Stefanie Posavec (known for Dear Data), I learned the basic techniques for working visually. I wrote this blog about it and later gave this workshop about it at DUO.
  • program to video call and share your screen

For advanced visual interviewers:

  • also give the other person editing rights in your program. Then take time for a brief intro and explain how the drawing program works. I set aside at least 10 minutes for this and do some practice together. Sometimes it is difficult and it might work easier if I draw and ask questions myself. The other person then thinks with me and gives me drawing instructions. That’s why I call it visual interviewing, because you help the other person tell their story in pictures or diagrams.

Getting Started

Enthusiastic to also draw together with your colleagues or the person you are interviewing? I hope this is of some use to you. It is fun to see how you tackle it, so please share your results with me (and others!) too.

Categories
How do you do research? Not part of a category Visual working

How we can see an automated decision

With increasing talk of algorithm supervision, it is important to know how a third-party study of algorithms can be conducted in government. Preferably in such a way that day-to-day implementation processes are not disrupted but according to the principle that government shows itself.

Since January, I have been working with a very nice group to design a work method for this. We focus mainly on the fixed, ‘dumb’ algorithms and not yet on self-learning algorithms. In this blog, a behind-the-scenes look at our approach, initial observations and two questions for you.

I can just see it

When I had just finished the study The compassionate civil servant, I was sitting with Marlies van Eck on a terrace in Utrecht toasting. She mentioned that she had a follow-up idea to her dissertation (on legal protection in automated chain decisions). Her main conclusion was that, as a lawyer, she could not say whether citizens were sufficiently protected because she could not see the algorithms. The government was a black box, so how can you test whether the decisions it makes are right?

Over my beer I said “but, how weird, because at the Executive Agency of Education, where I worked, I can just see them’. Of course, I immediately began to doubt myself when I said that, but I looked up the photo interview of Cees-Jan talking about decision rules from which the code is then derived. And I mentioned that we were also working to derive the calculation tools on duo.nl from these decision rules so that, as a student, you can simulate how the computer will decide in the future how to pay off your student debt.

Opening and viewing

I am reminded of our conversation frequently because “being able to see the algorithm” is central to this research.

Marleen Stikker writes in her book The Internet is Broken that you only really own something when you can open it up to fix or change it. If you can’t, as with most contemporary technology, the device owns you. Can we open up government’s computers and see how they decide and possibly change that if necessary?

This area is still relatively unknown. The Dutch Tax Service has developed a method for making algorithms testable and explainable. The State Audit Office and accounting firms are preparing for this new task. The General Audit Office has developed a review framework. Recently, the State Council issued a report on automated law enforcement, among other things.

But what is suitable for a financial expert may not work for a researcher who wants to do a legal check. It is also tedious for an implementing organization when different disciplines and organizations consider the use of algorithms at different times and burden the implementation with questions. Both for researchers, and for implementing organizations, a more integrated approach is important.

Say no more. So with a group that I spontaneously get imposter syndrome from, we started in January to experimentally design a method for this. The group: Marlies van Eck, Steven Gort, Abram Klop, Robert van Doesburg, Mariette Lokin, Carlijn Oldeman, Giulia Bössenecker and me. Colleagues from the Executive Agency of Education and the Social Secutiry Bank are cooperating and offering us their automated decisions as trial material to design the method on.

What we want to achieve

Allright. We want to develop a working method for conducting third-party research on a government organization’s use of algorithms. To this end, we have formulated a thought scheme:

  • We study how the use of algorithms can be examined simultaneously legally, financially and model-wise[topic].
  • because we want to know which discipline would like to see which research questions answered[rationale].
  • so that we understand the least burdensome approach to a multidisciplinary and comprehensive assessment[significance].

To keep the research sufficiently concrete but also manageable, we propose that the working method should meet the following four objectives:

  • the working method allows a lawyer to make a judgment on the legality and propriety of the system,
  • the working method allows a data scientist/ information scientist to make a judgment about the quality of the system,
  • the working method enables an accountant or internal controller to make a judgment about …[to be completed, see also help question at the end of this blog],
  • the working method is suitable for repeated use in various public organizations.

Designing the method

In a series of on-site making days, we will work with a government organization. Lucky for me: the first 2 making days are at the Executive Agency of Education in Groningen where I live.

To arrive at a working method that can stand on its own within a few months, we take an embedded and iterative approach. But we must remember to design ourselves out of the method as well, and thus critically examine our bias. We learn by doing: we dive into an algorithm and record our process. Then we reflect on our process and make it explicit. What comes out of this is potentially the method we want to develop.

This is how we shape the creation process:

Outline of the design process divided into the 4 making days and intermediate actions

Together with the Executive Agency of Education, we chose a few automated decisions that are part of the big decision whether or not a student will receive a student loan: the nationality test, the age test and the partner test. Beforehand, we were given the sets of decision rules of these three tests to study firmly.

We decided to look from three perspectives or levels of abstraction. Different questions are important for each perspective.

Perspective 1 is the algorithm itself. How does the decision come about?

  • What are the decision rules dealing with the nationality test?
  • What sections of the law are the decision rules based on?
  • How are the decision rules programmed?
  • How are they included in the work instruction?
  • What data is needed and what are sources?
  • How is the decision explained to the student (user) in personal and general communication?
  • What interaction does a student (user) have with the algorithm and how does this influence the decision?

Perspective 2 is the creators of the algorithm. How does the algorithm come about?

  • Who (what roles and also individuals) are involved in the creation of the algorithm?
  • What considerations were made in the creation of the decision rules?
  • On what basis do these individuals make these trade-offs? What personal bias is there?
  • Is there documentation of this creation, and if so, what is recorded here and for what purpose?
  • What is implicit and difficult to make explicit here? In other words, what do we not know (yet) or cannot know (anymore)? How does this come about?

Perspective 3 is ourselves, the supervisors so to speak. How does the method come about?

  • How did we proceed? What questions did we ask? What worked well and what didn’t?
  • Which questions belong to which discipline (lawyer, accountant and information scientist)? Is there any overlap? Were all disciplines able to get their answers? How do they reinforce each other?
  • What knowledge and expertise do we have that allows us to ask these questions?
  • Can we reproduce our process next time? What would be different?

‘How crazy it is here’

The first day of making was wonderfully chaotic. We were flying in all directions, asking all kinds of questions, and Jean and Cees-Jan from the Executive Agency of Education were infinitely patient to answer all questions. Sometimes we ended up in heated discussion about the way the organization was organized, only to conclude after an hour that that shouldn’t matter at all for the method. Or as Steven so aptly noted, “I couldn’t care less how it is put together.” :’)

After this day of making, Marlies wrote a first blog with her observations and I made a video for the scientific guidance committee and the sounding board group.

Video (in Dutch) showing the experience of the first day of making at the Executive Agency of Education.

The second day of making went a lot more structured. In preparation, I visualized on a digital board all the steps from law to decision. I asked Cees-Jan if he could fill in everything from another decision (the partner test). This was not so simple because the information and docs had to come from all sorts of nooks and crannies of the organization.

I printed what I got (or left a step open) and put the steps on the floor. Underneath I put 3 long sheets of paper for the questions the lawyer, accountant or developer could ask. Perspective 1 and 3 are below each other. We took all afternoon to fill them out and see if we could get answers directly from Cees-Jan and colleagues (perspective 2).

An impression of what that looked like:

In two weeks we will have make day 3 at the Social Security Bank. That will be uncharted territory for me, fun! We are going to look at the age and partner test in the state pension.

In preparation, I digitized the large board we made on the ground at the Executive Agency of Education. It became a version with questions and a blank version for the Social Security Bank colleagues to fill in themselves. We are going to test this prototype and see if this is already a tool for self-assessment to show as an organization how your algorithm comes about and makes a decision.

Through this miro board, you can better zoom in on the prototype. You can also post comments here, and feedback is welcome!

Prototype of the working method we will soon test with the Social Security Bank

Two questions

You can see that the accountant’s perspective has no questions yet. Here we are still searching. Auditors are very busy around February and March because of wrapping up the previous year. So we haven’t been able to include much input from that side. Do you know more about this or know someone who can help, let me know.

And of course: feedback in general. In this blog, I describe our making process and show the prototype. I’m curious what you think of this and how it would work in your organization. After design day 3, we would like to update our prototype and share it with organizations to use without us for self-assessment. So we want to learn from your findings in turn.

If you would like to help with this, please send me a message. You can do so through maike @ klipklaar.nl or the other known ways. Thanks!