This summer I am immersing myself in all the observations, conversations and activities I have participated in over the past six months. Since February, I have been following the Clustering Government Collection program. In early July, I got the bright idea to take a look at the data I had collected so far. That was quite a lot. In this blog I will tell you how I collected this data, and how I analyze it.
If you want to follow my research, subscribe to my monthly newsletter.
Last month I wrote about how I set up the empirical study. As an action researcher, I observe what is happening but also actively participate. I am following a government program that is redesigning services in the debt domain based on human-centered principles. You can read this blog here: case selection done.
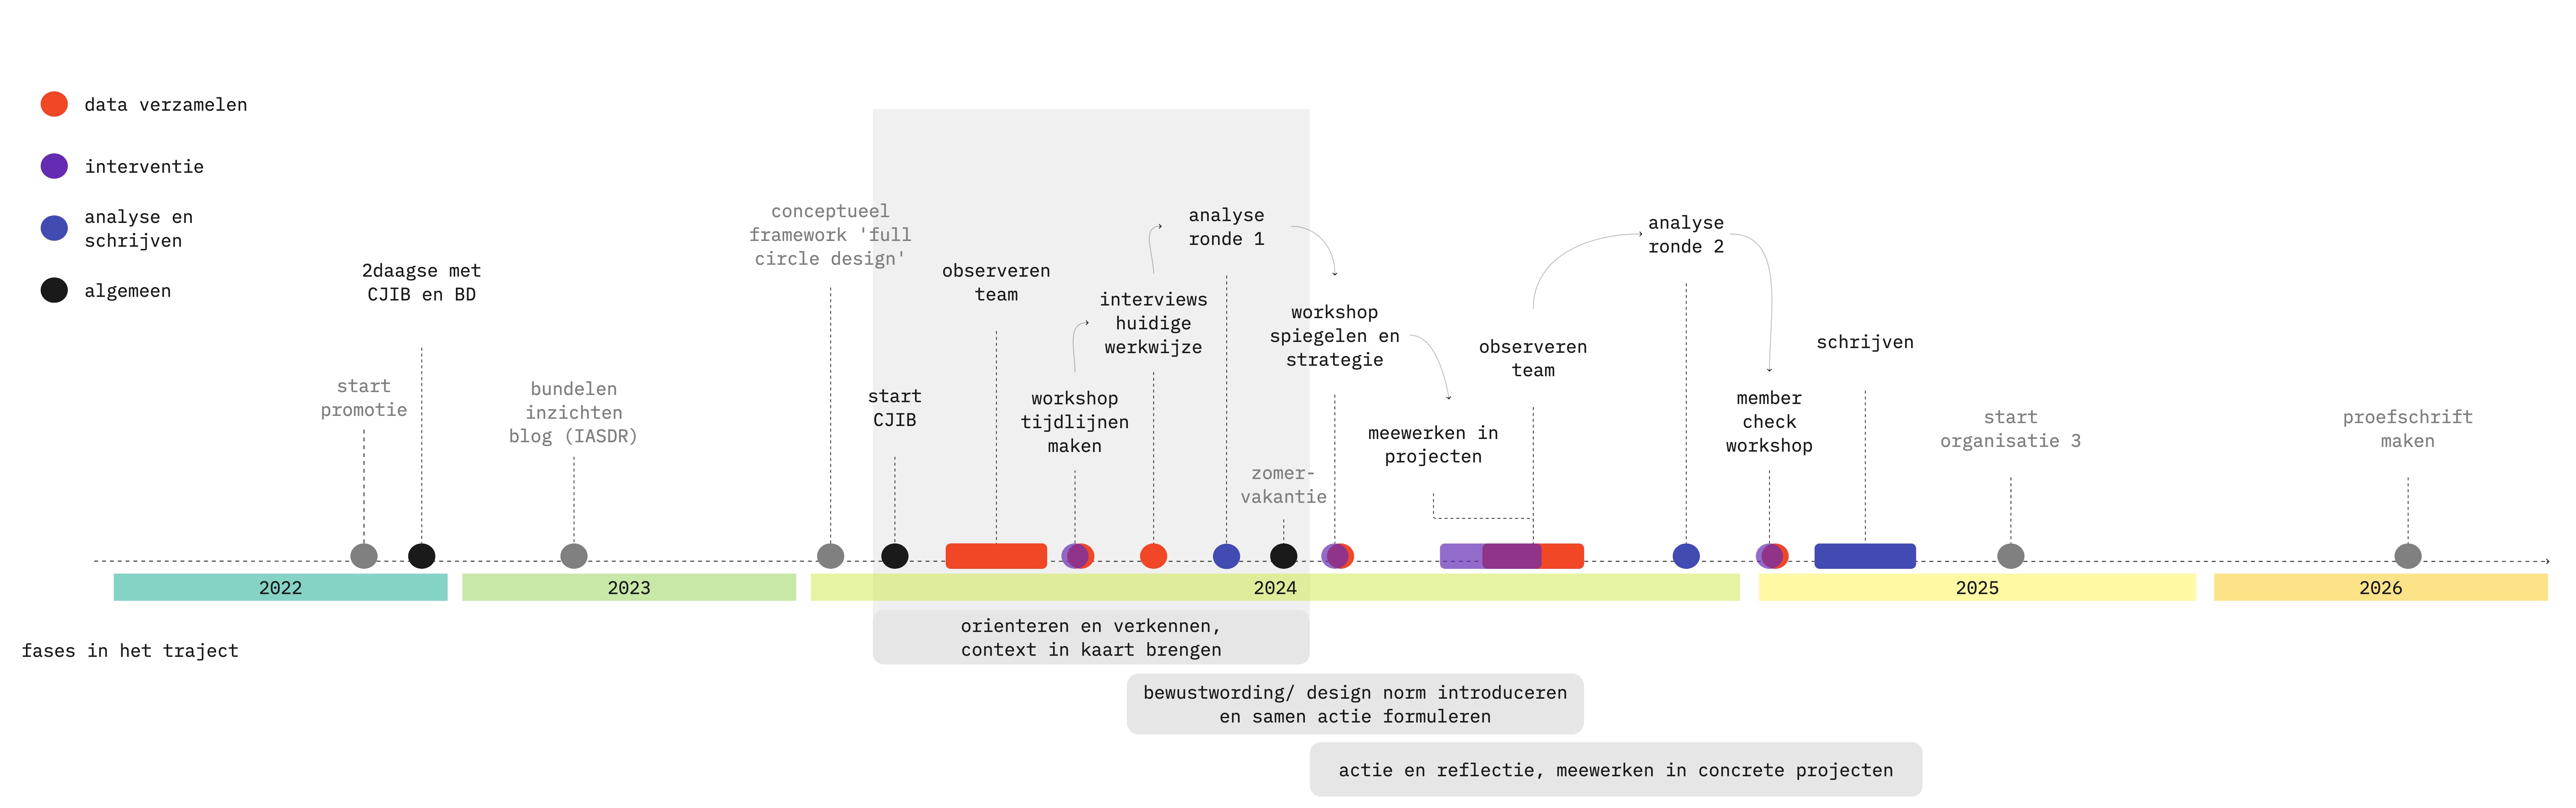
In that blog, you’ll also see that I divide my research into several phases. The outcome of one phase determines the approach to the subsequent phase. I determine the approach together with the participants who participate in the research. This summer I am focusing on the “unfolded” gray area.
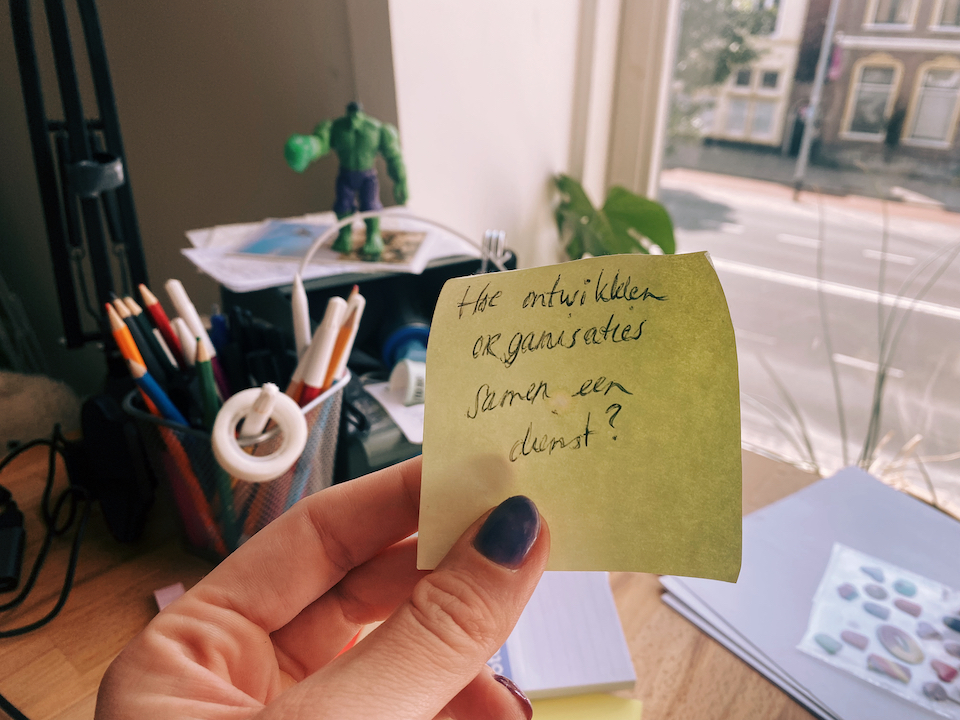
You always start with a question
There is, of course, a reason why you engage in a particular group and context. You want to know something. This semester I have focused mainly on 2 sub-questions:
- How do organizations create a service together?
- What helps and hinders them in the human-centered design of such a service?
Before I began this doctoral research, I had some experience doing research. This blog is full of it! This is mostly applied qualitative research for organizations. Over the past two years, I have read a lot about the requirements of science for new knowledge based on qualitative research. In particular, I looked at how data is collected and analyzed in ethnographic and participatory action research.
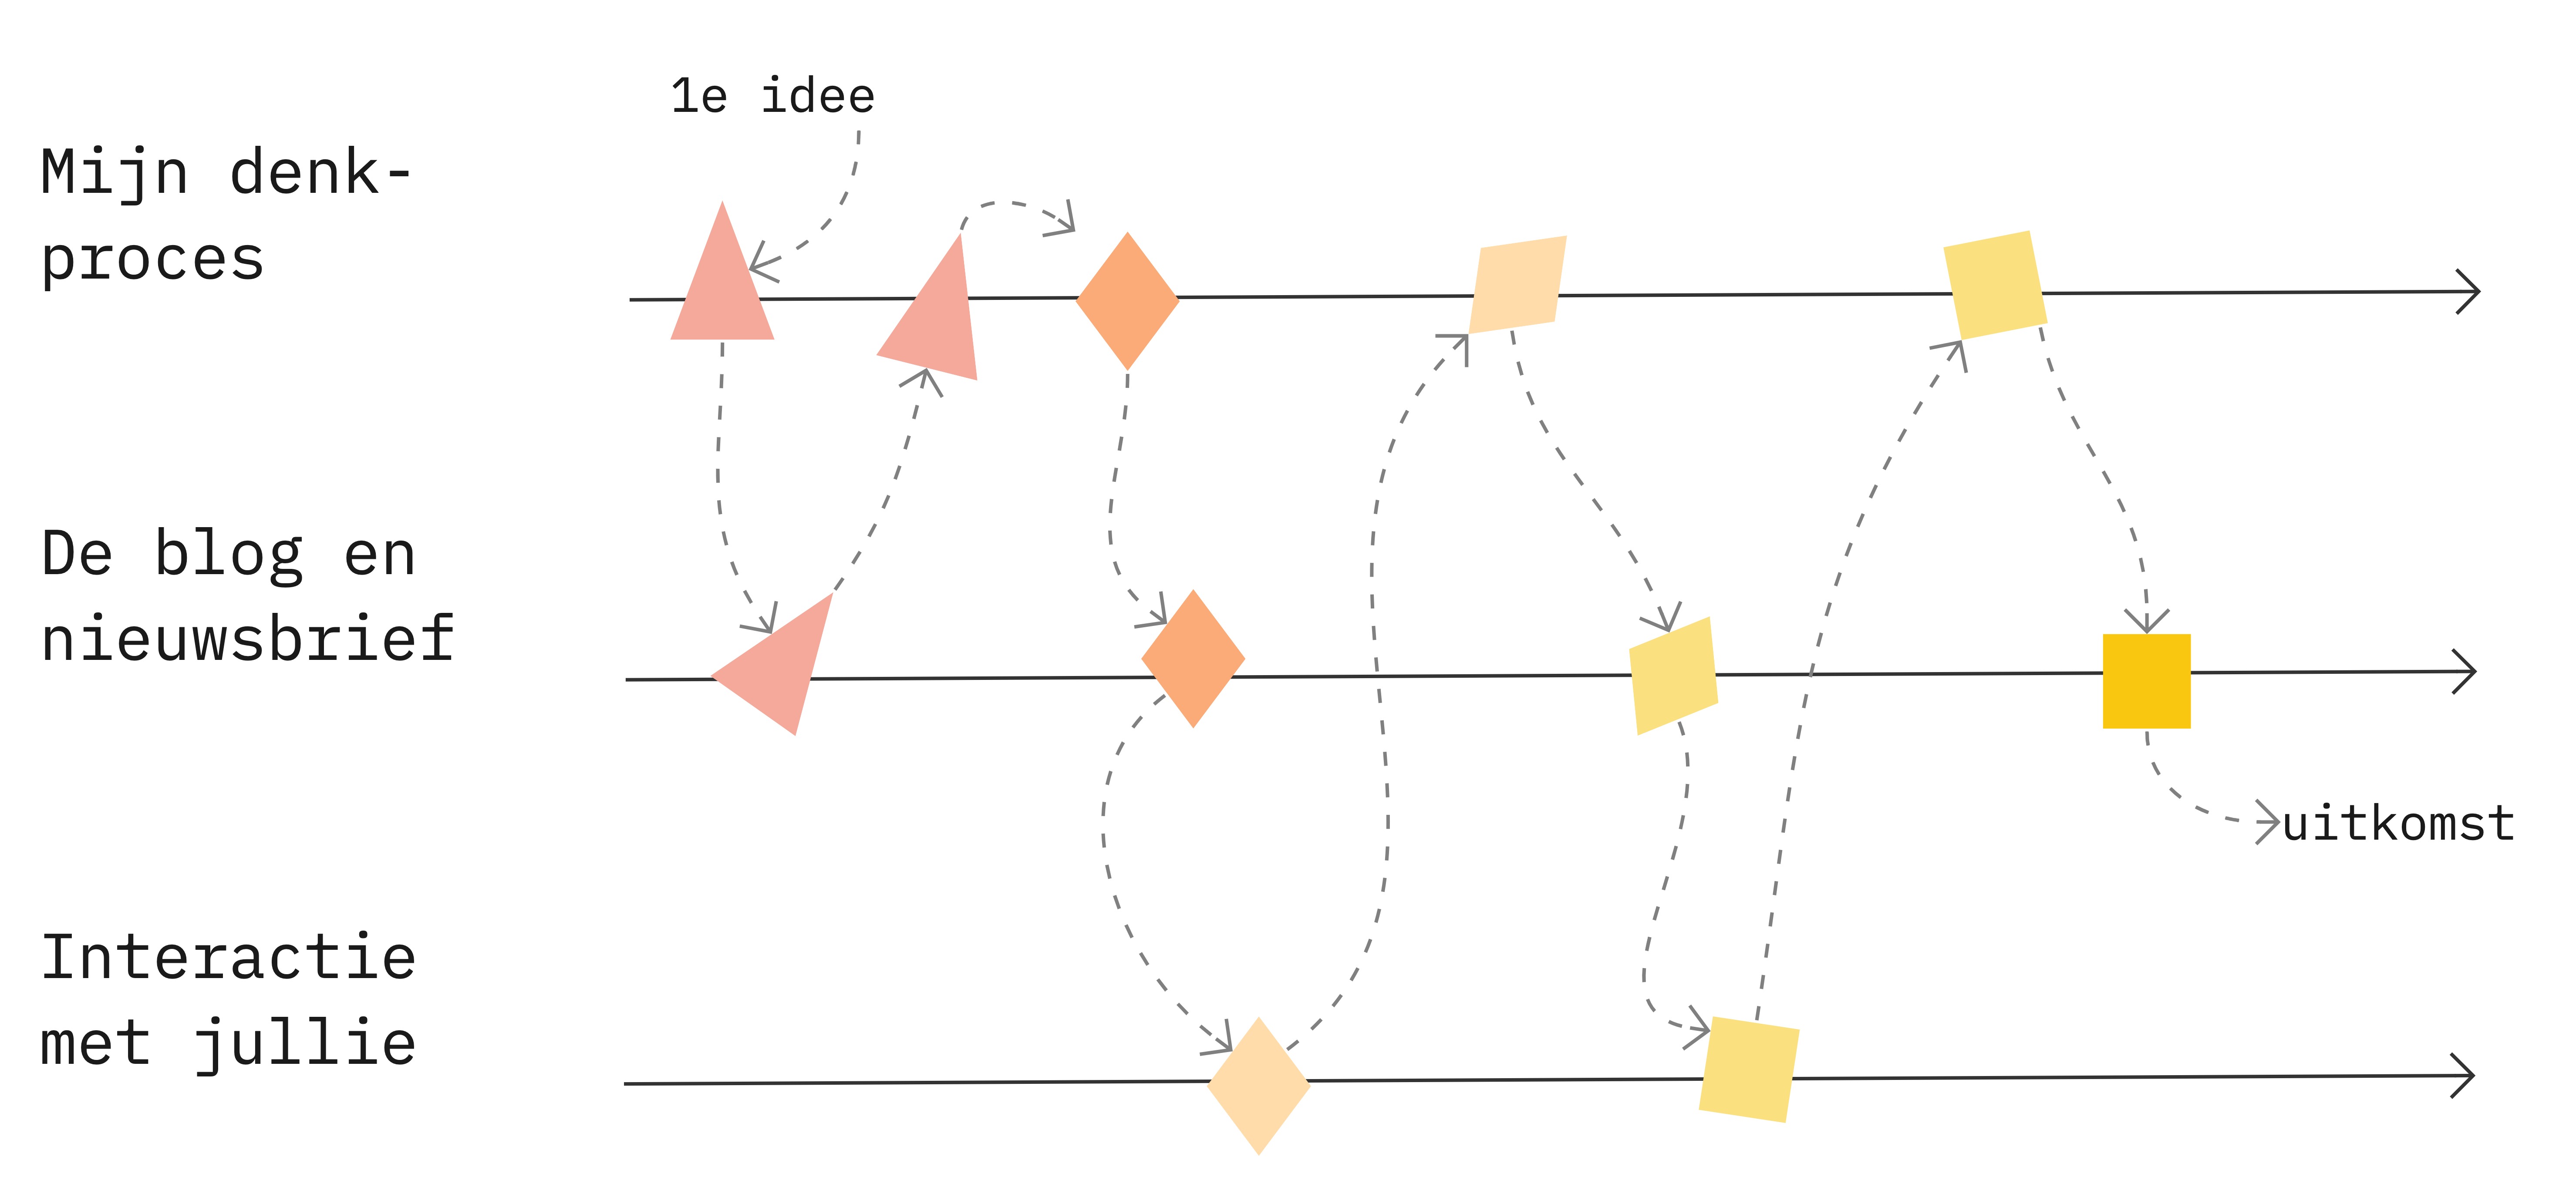
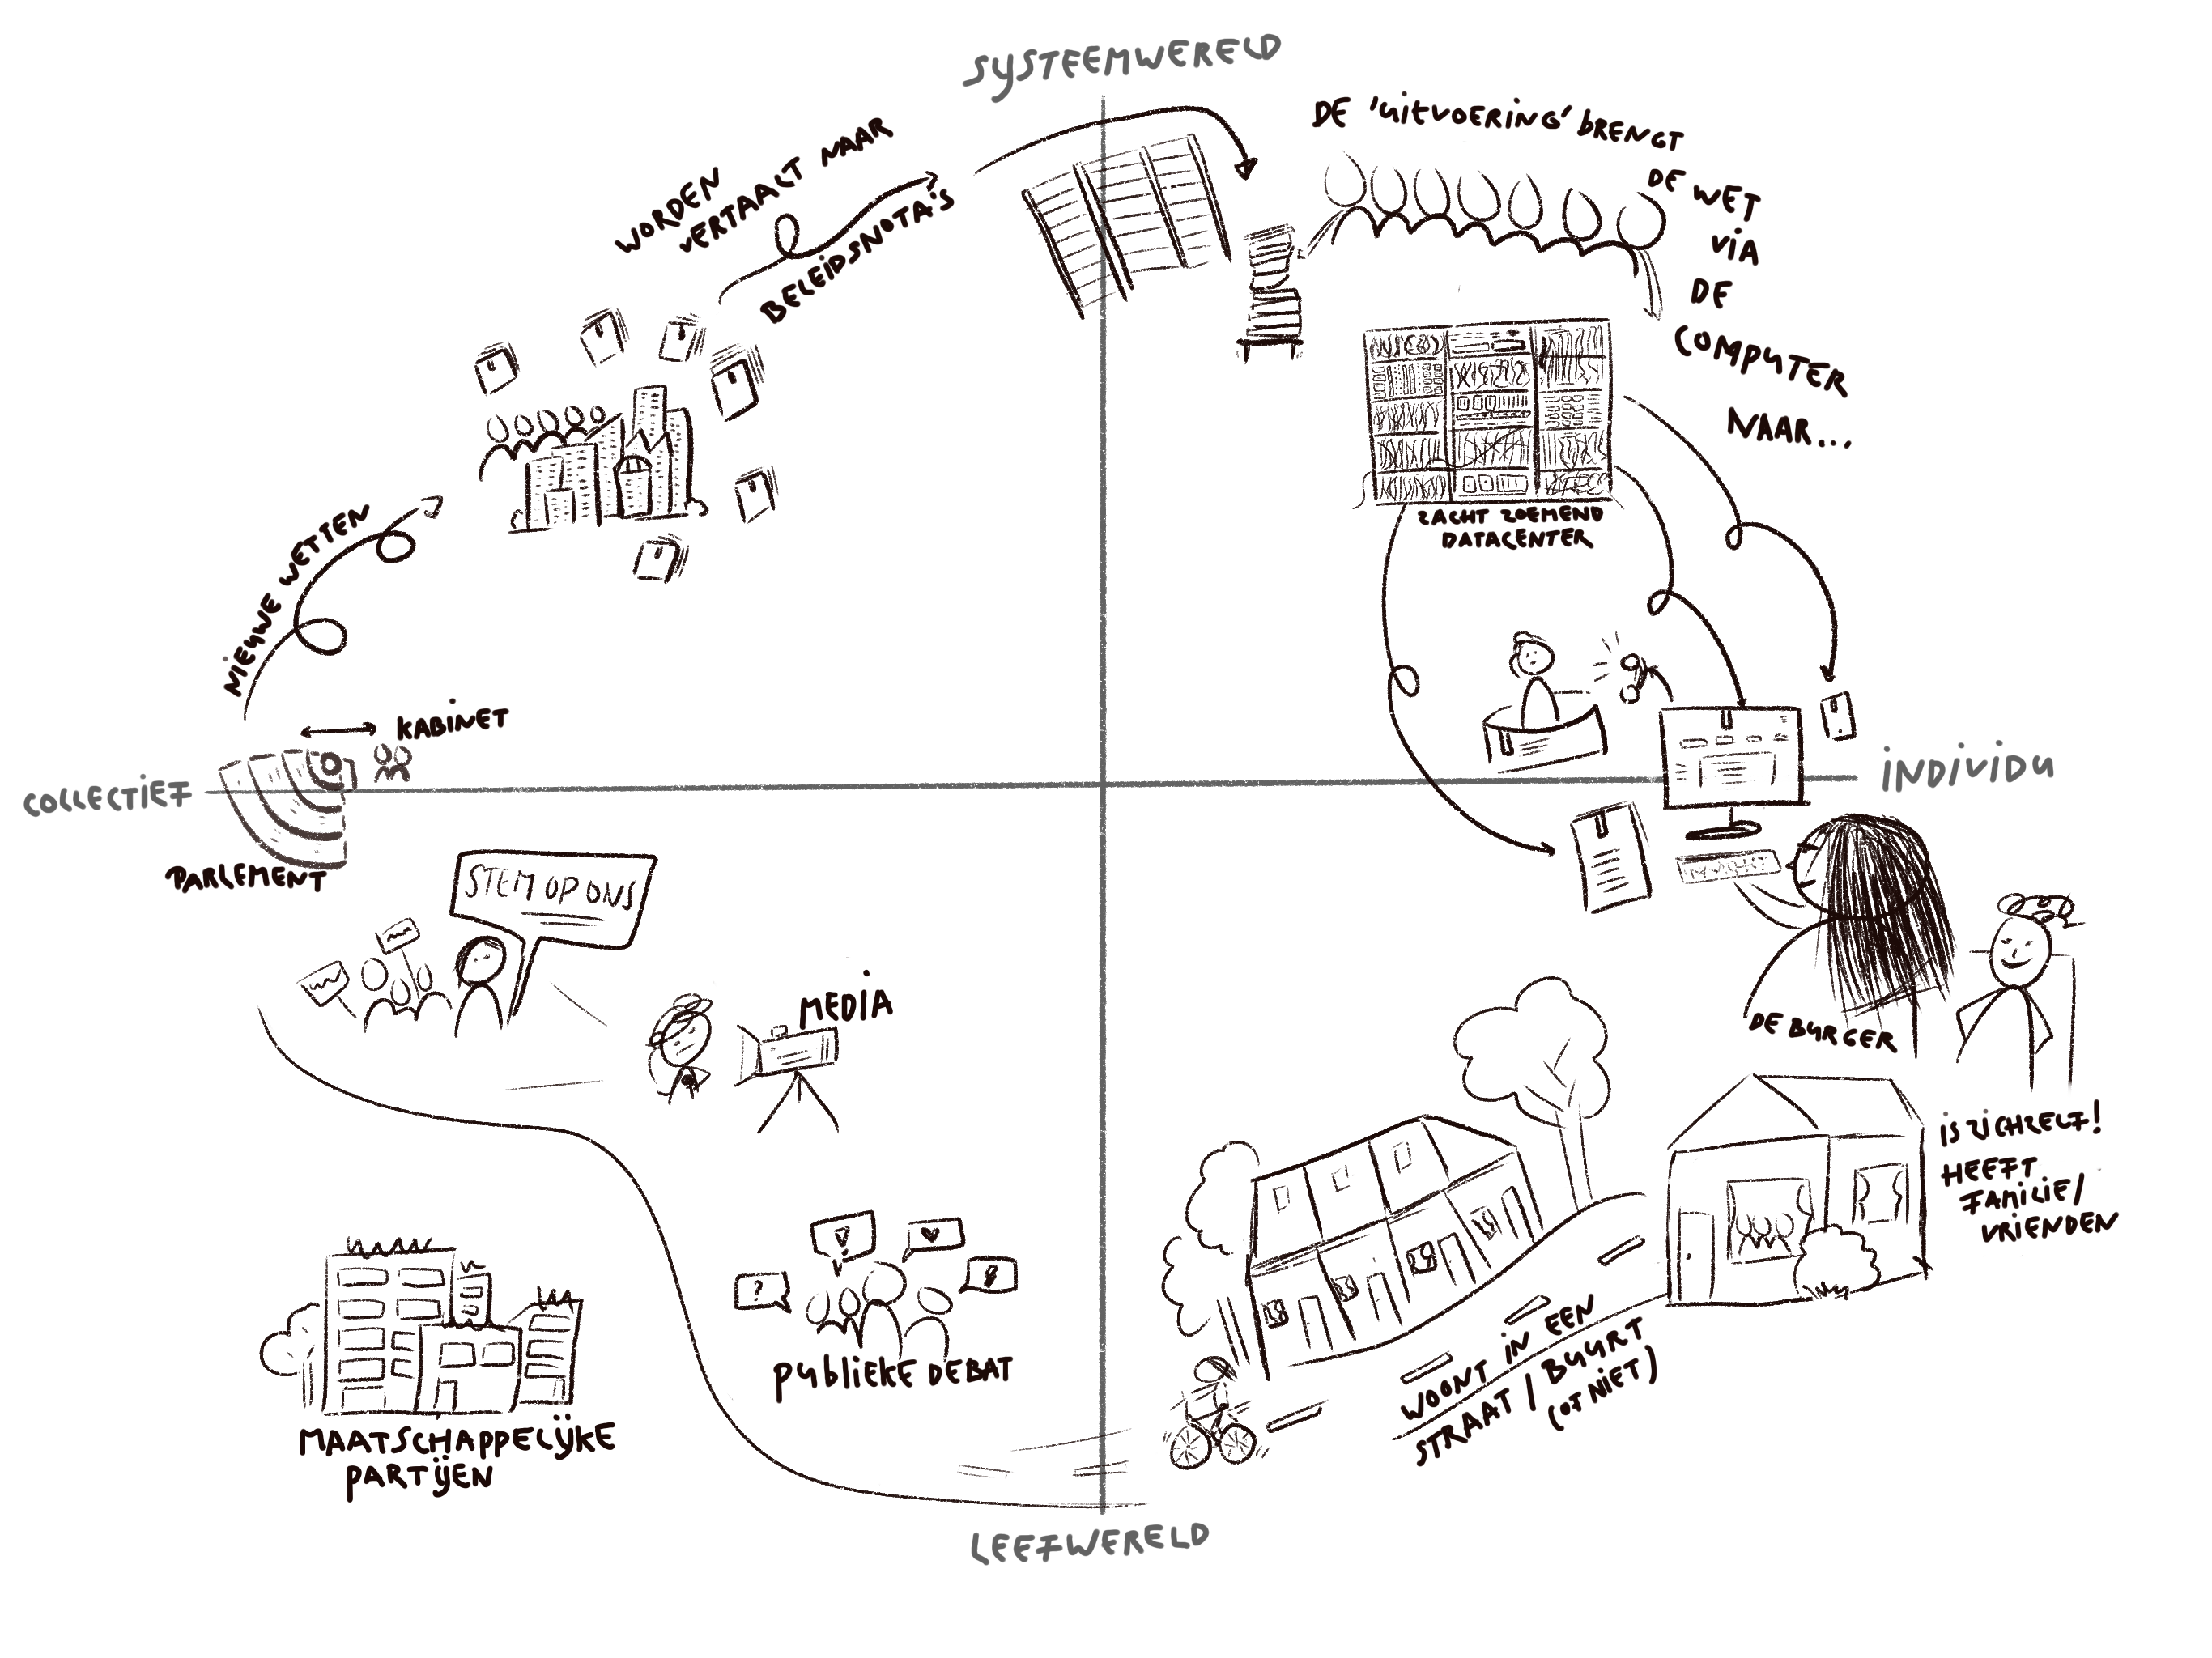
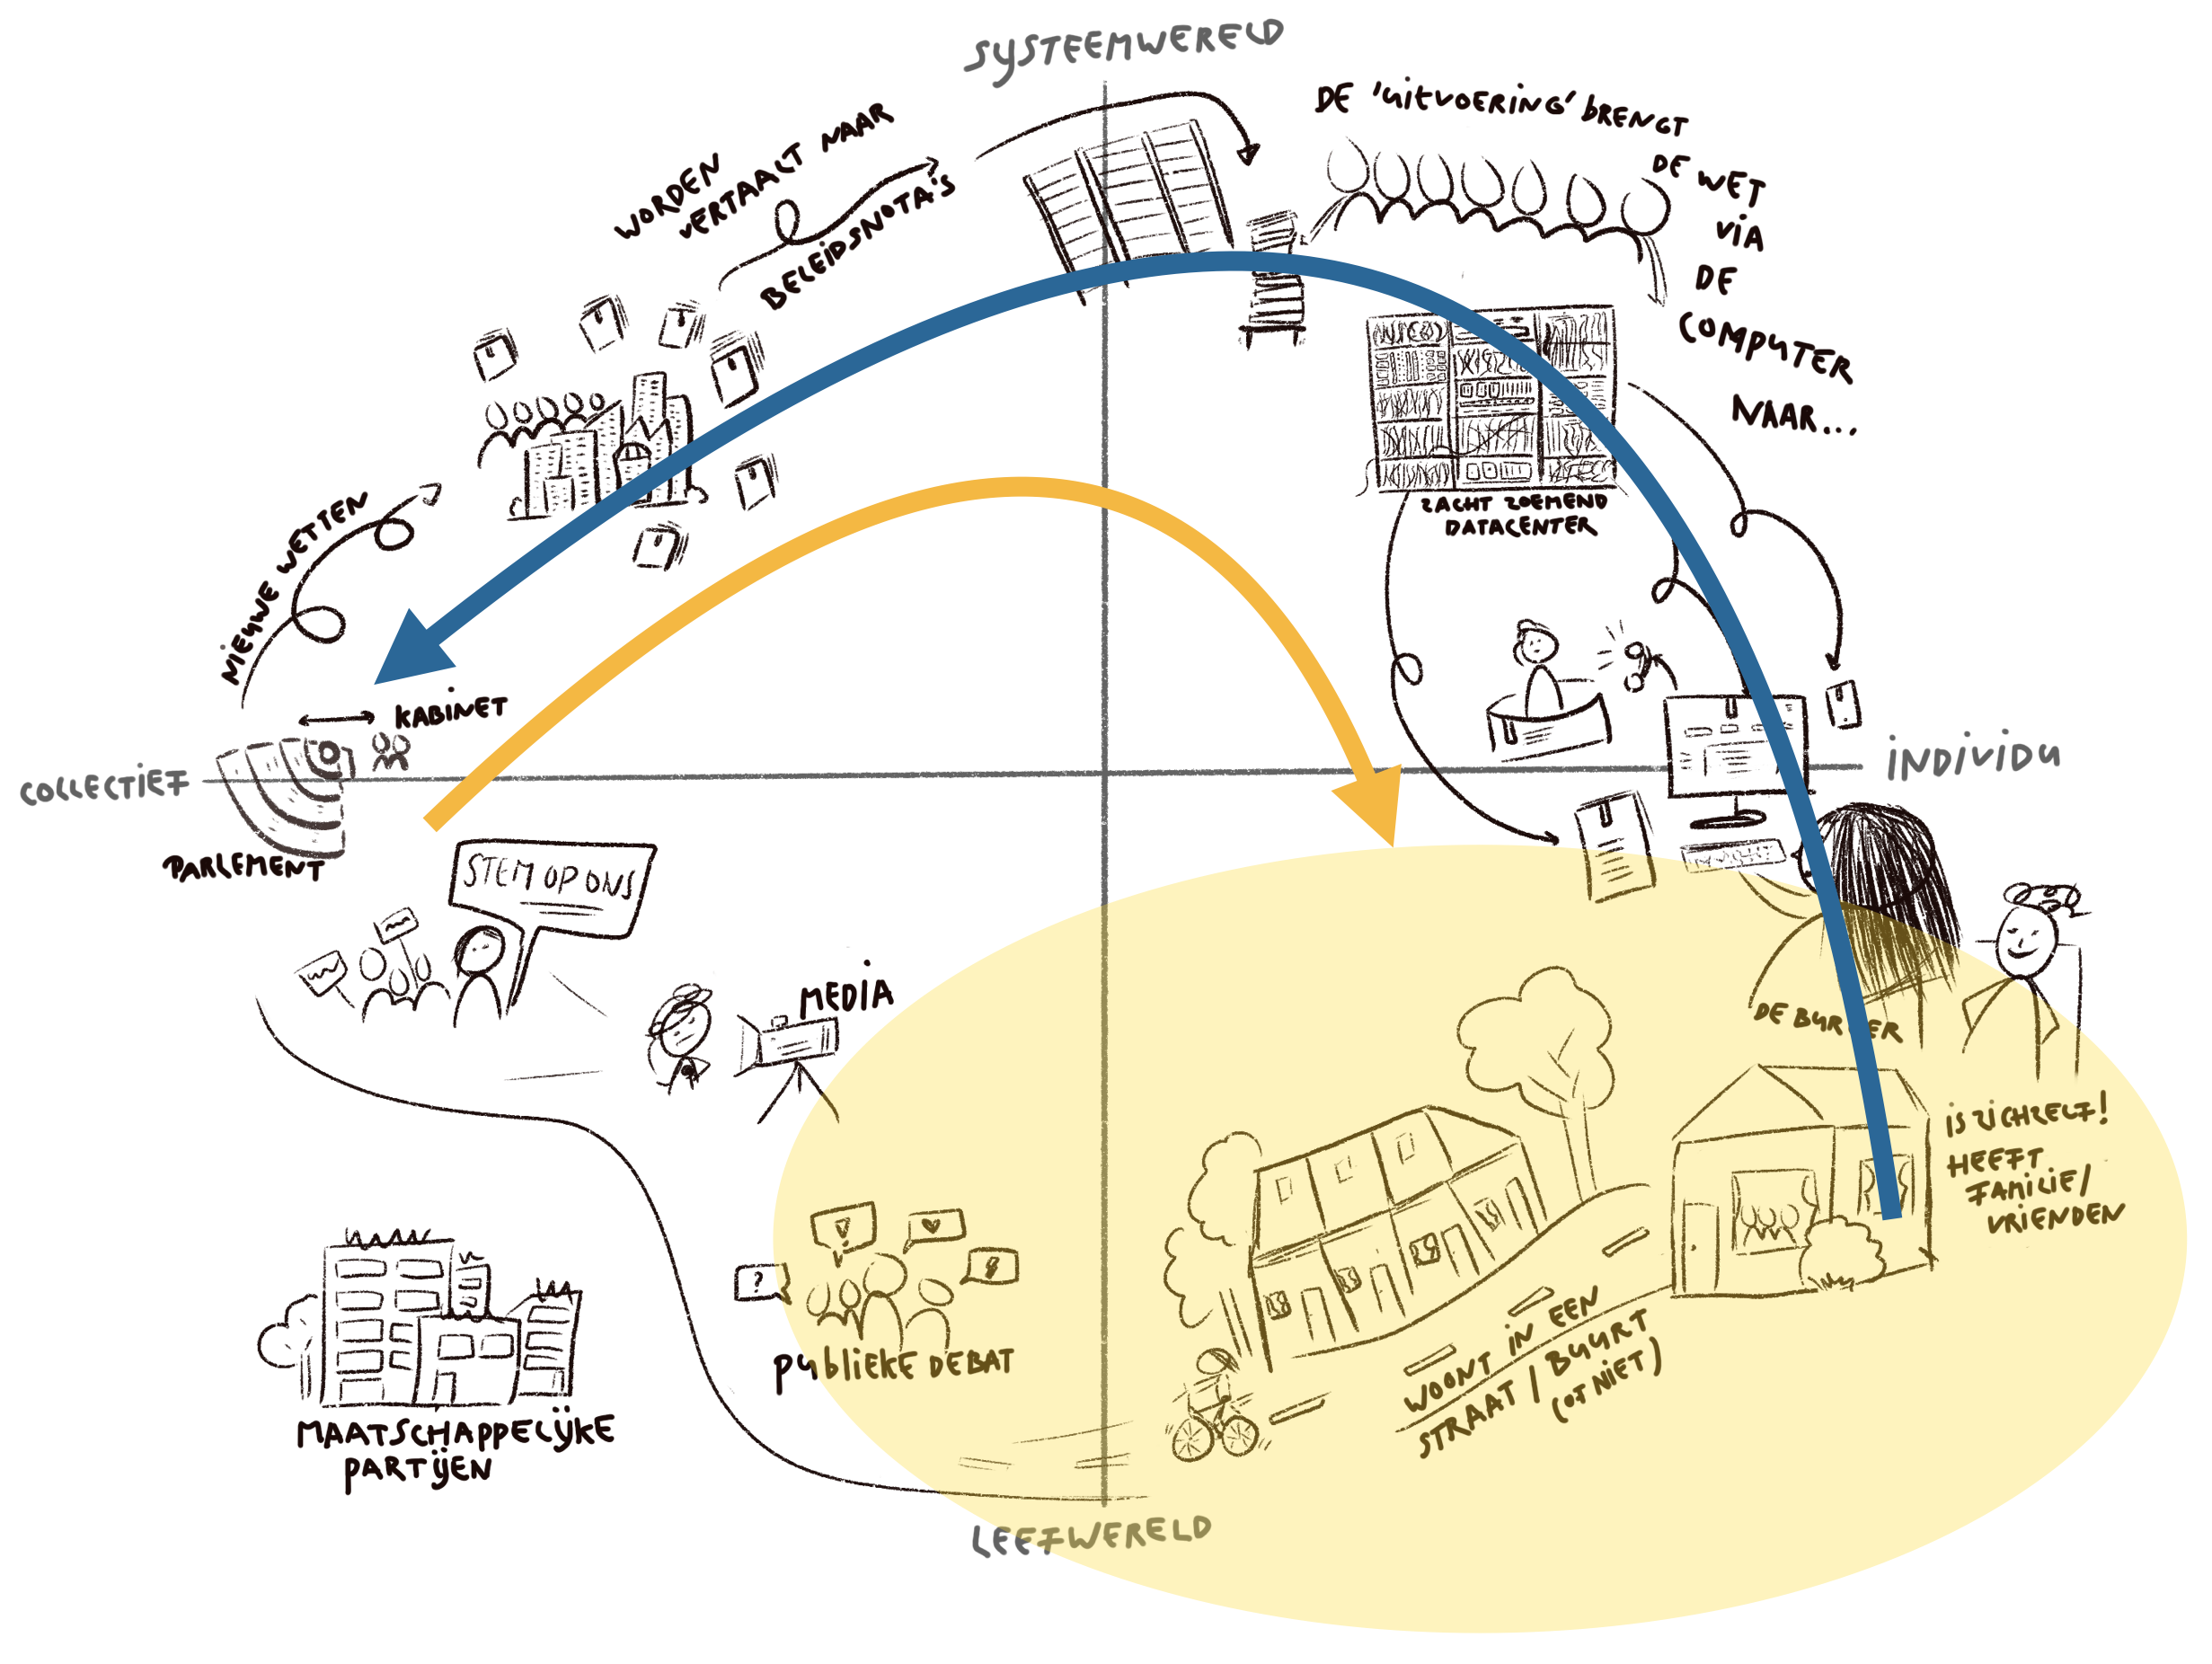
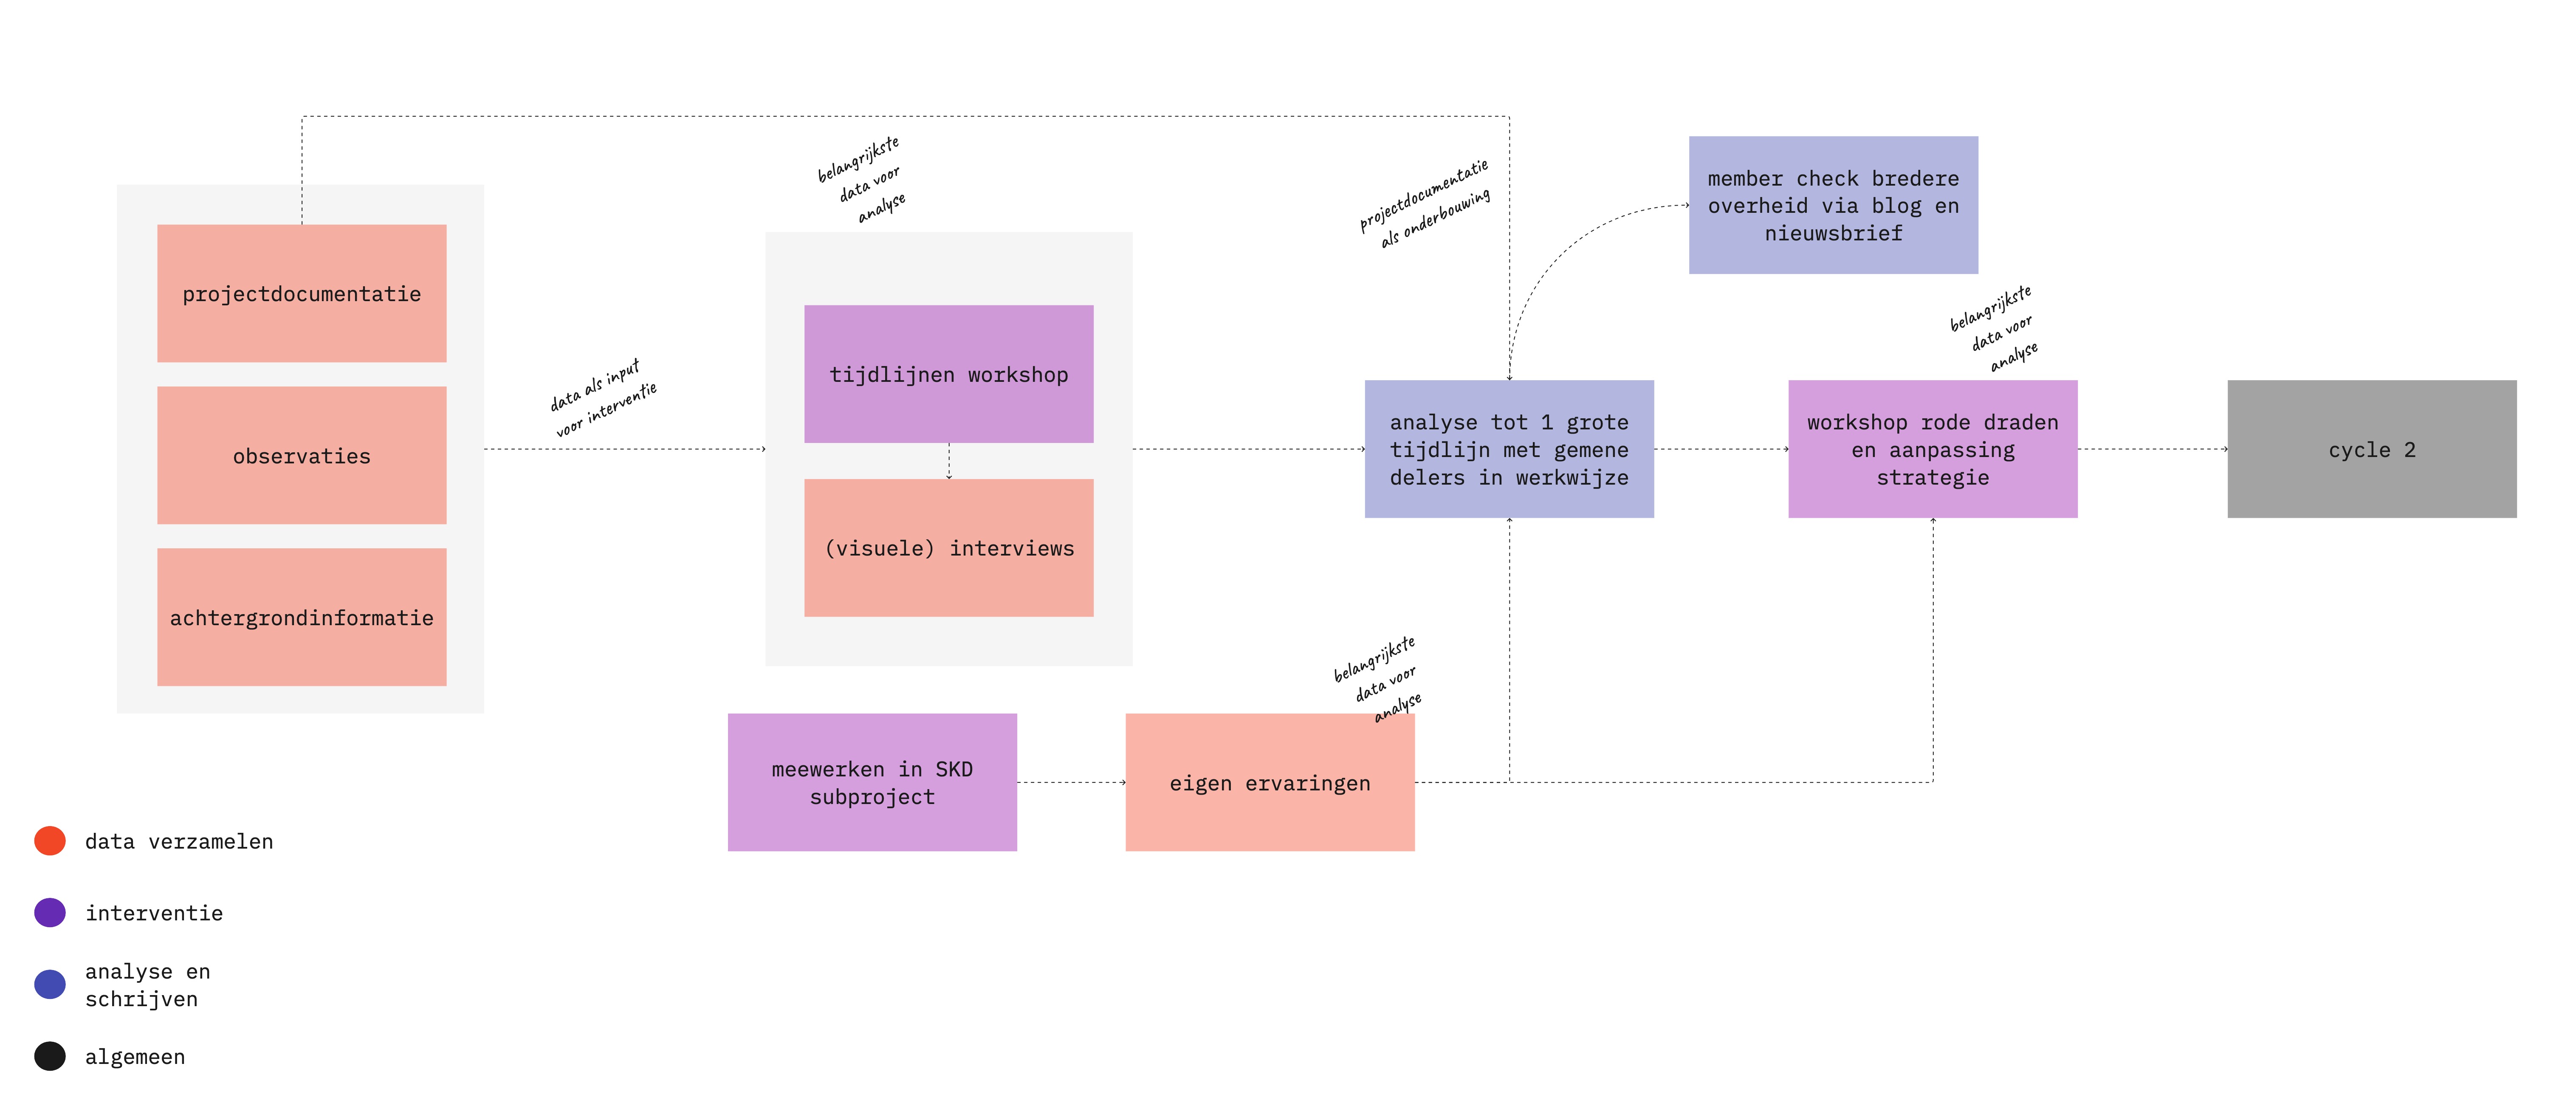
An important principle, for example, is triangulation: using different data sources that complement each other. If you observe something in behavior, discuss it in interviews and find it in the organization’s documents used, your story is better substantiated. This also applies the other way around: someone can say something, but then if you don’t observe it or can’t find it anywhere in the organization’s archives, well….
My data-gathering strategy
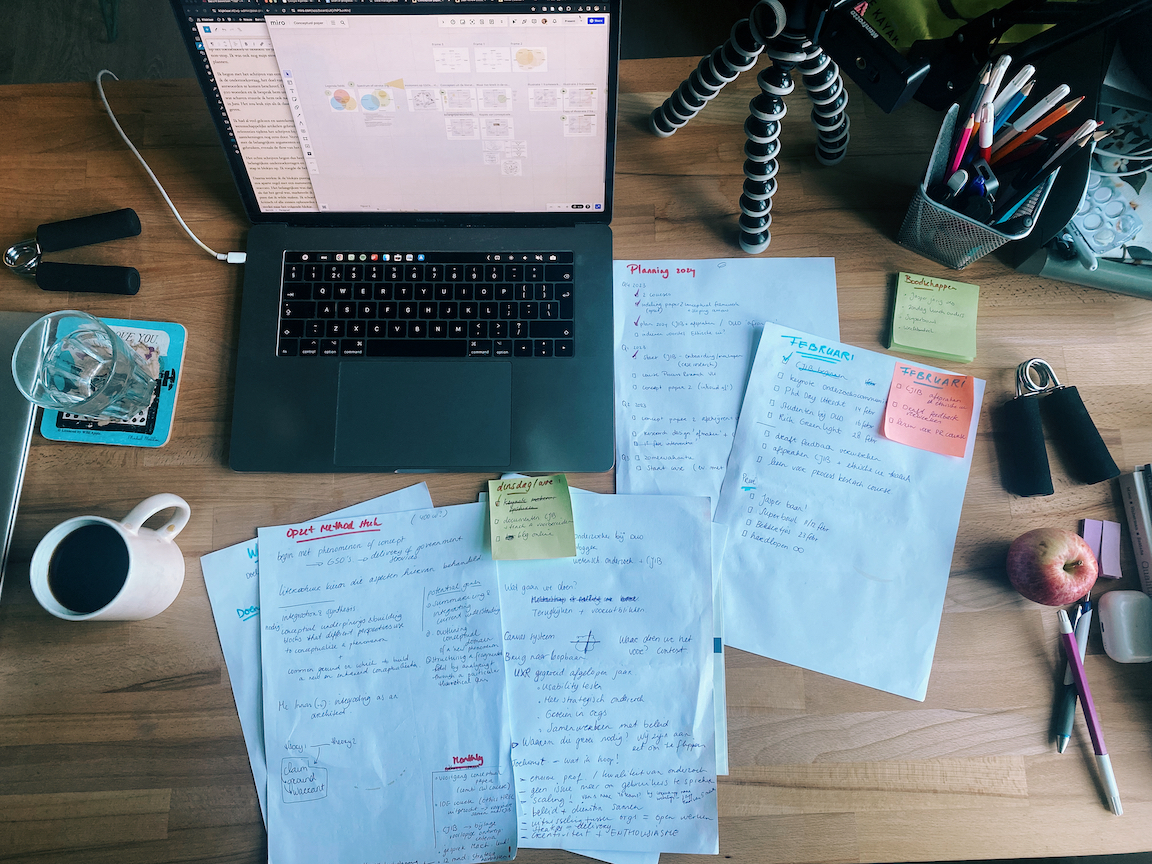
I collected data in several ways. Some were intended as input to another way of collecting data, which were then important sources for my analysis.
I kept observations each week in a diary. In all, I have 22 diaries, ranging from 4 to 10 A4 sheets. I joined meetings, had lunch with participants and talked with colleagues between activities. I wrote down what was happening and what I noticed.
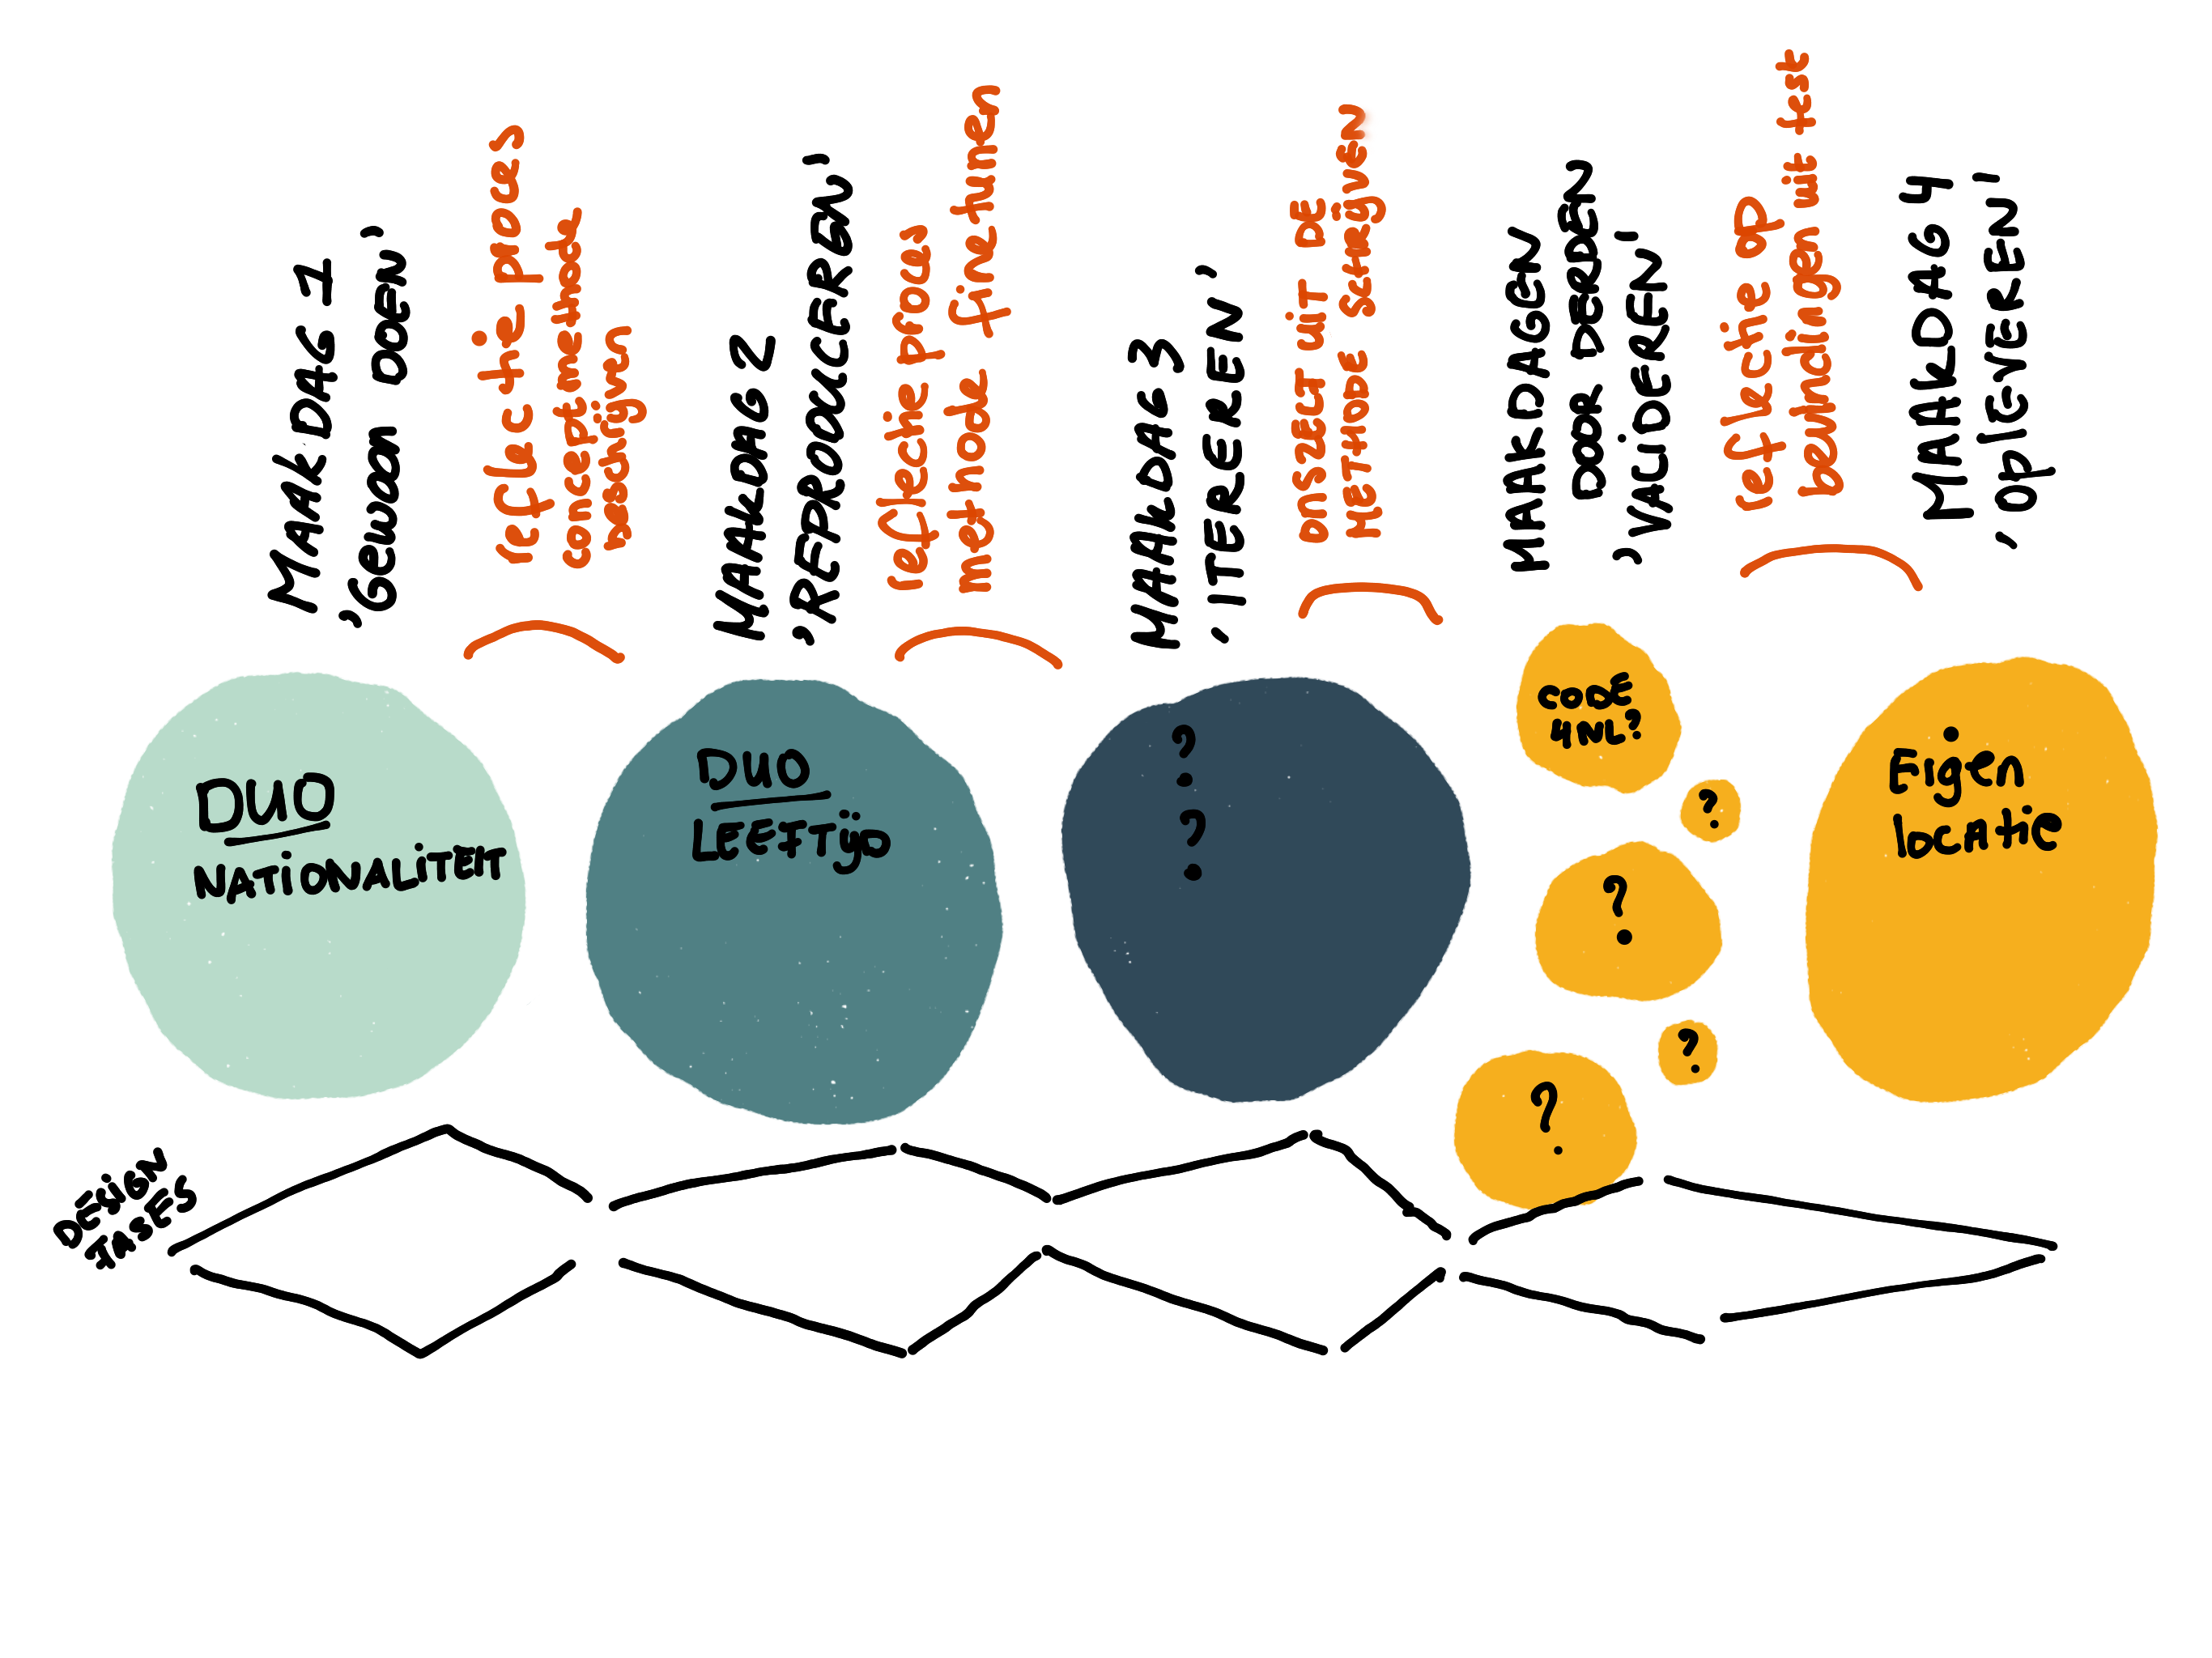
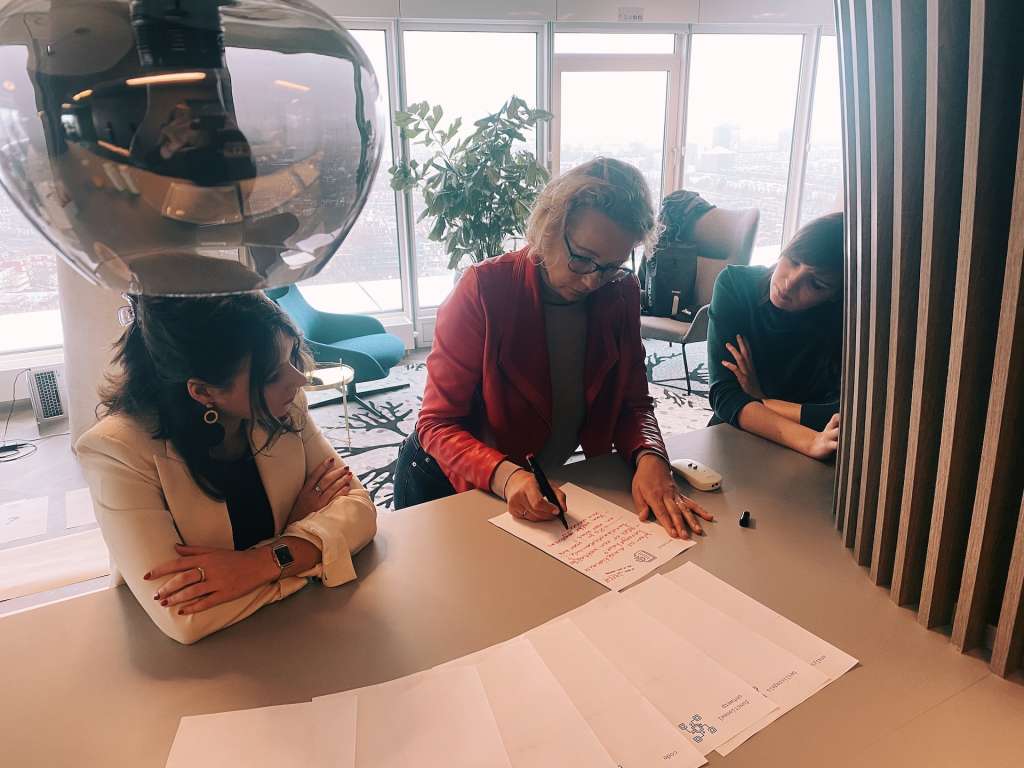
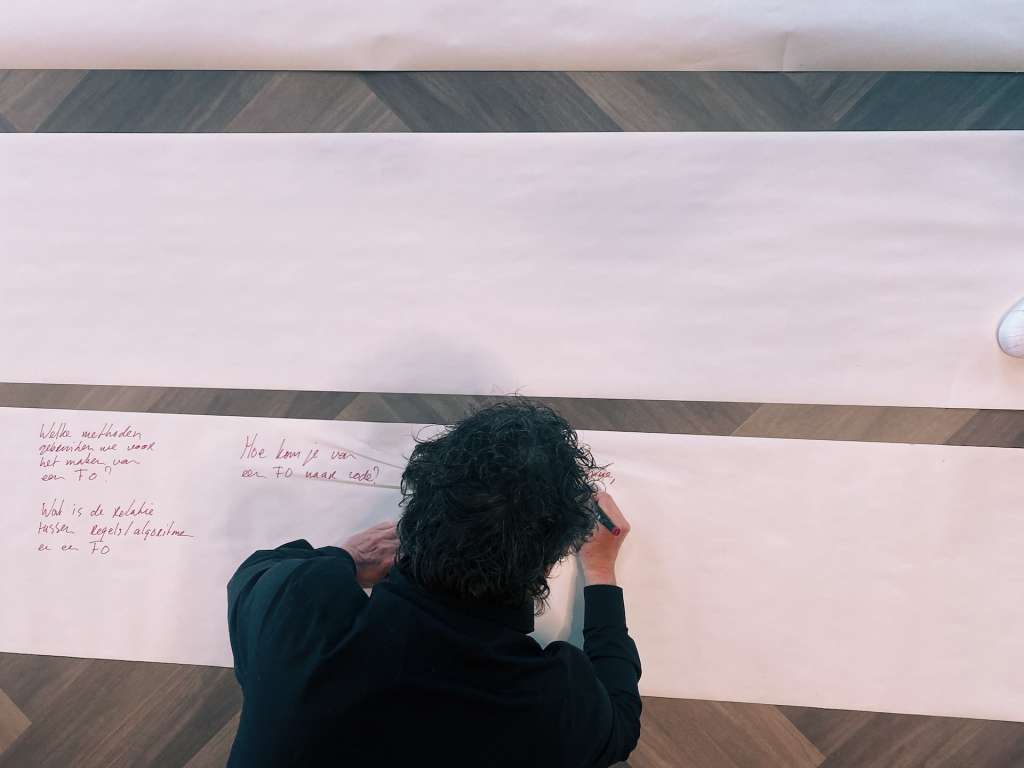
In early April, I organized a workshop with the program’s core team. Everyone made a timeline with moments that were defining for them. We then exchanged experiences in a group discussion and responded to each other’s timeline. I made a start on a joint timeline during the discussion.
The observations and timelines provided the input for personal interviews with 13 colleagues involved in the program. The interviews were free format. We discussed the timeline they had made and I asked about their general ideas about what good services are and how to make them.
I myself collaborated on a sub-project. I kept my own reflections in the same diary. I already wrote the blogs Reframing leads to new solutions? and A day with a court bailiff about this project.
I used program documentation such as mail exchanges, meeting notes and vision documents. There is even a Whatsapp message in my data collection! I used these documents primarily as additional substantiation for observations or statements from the interviews.
How the sources support each other looks like this:
Through the pile of data
In early July, I temporarily stopped collecting data. Time to see if I could already formulate answers to the questions. In 2 ways I went through all the data thoroughly.
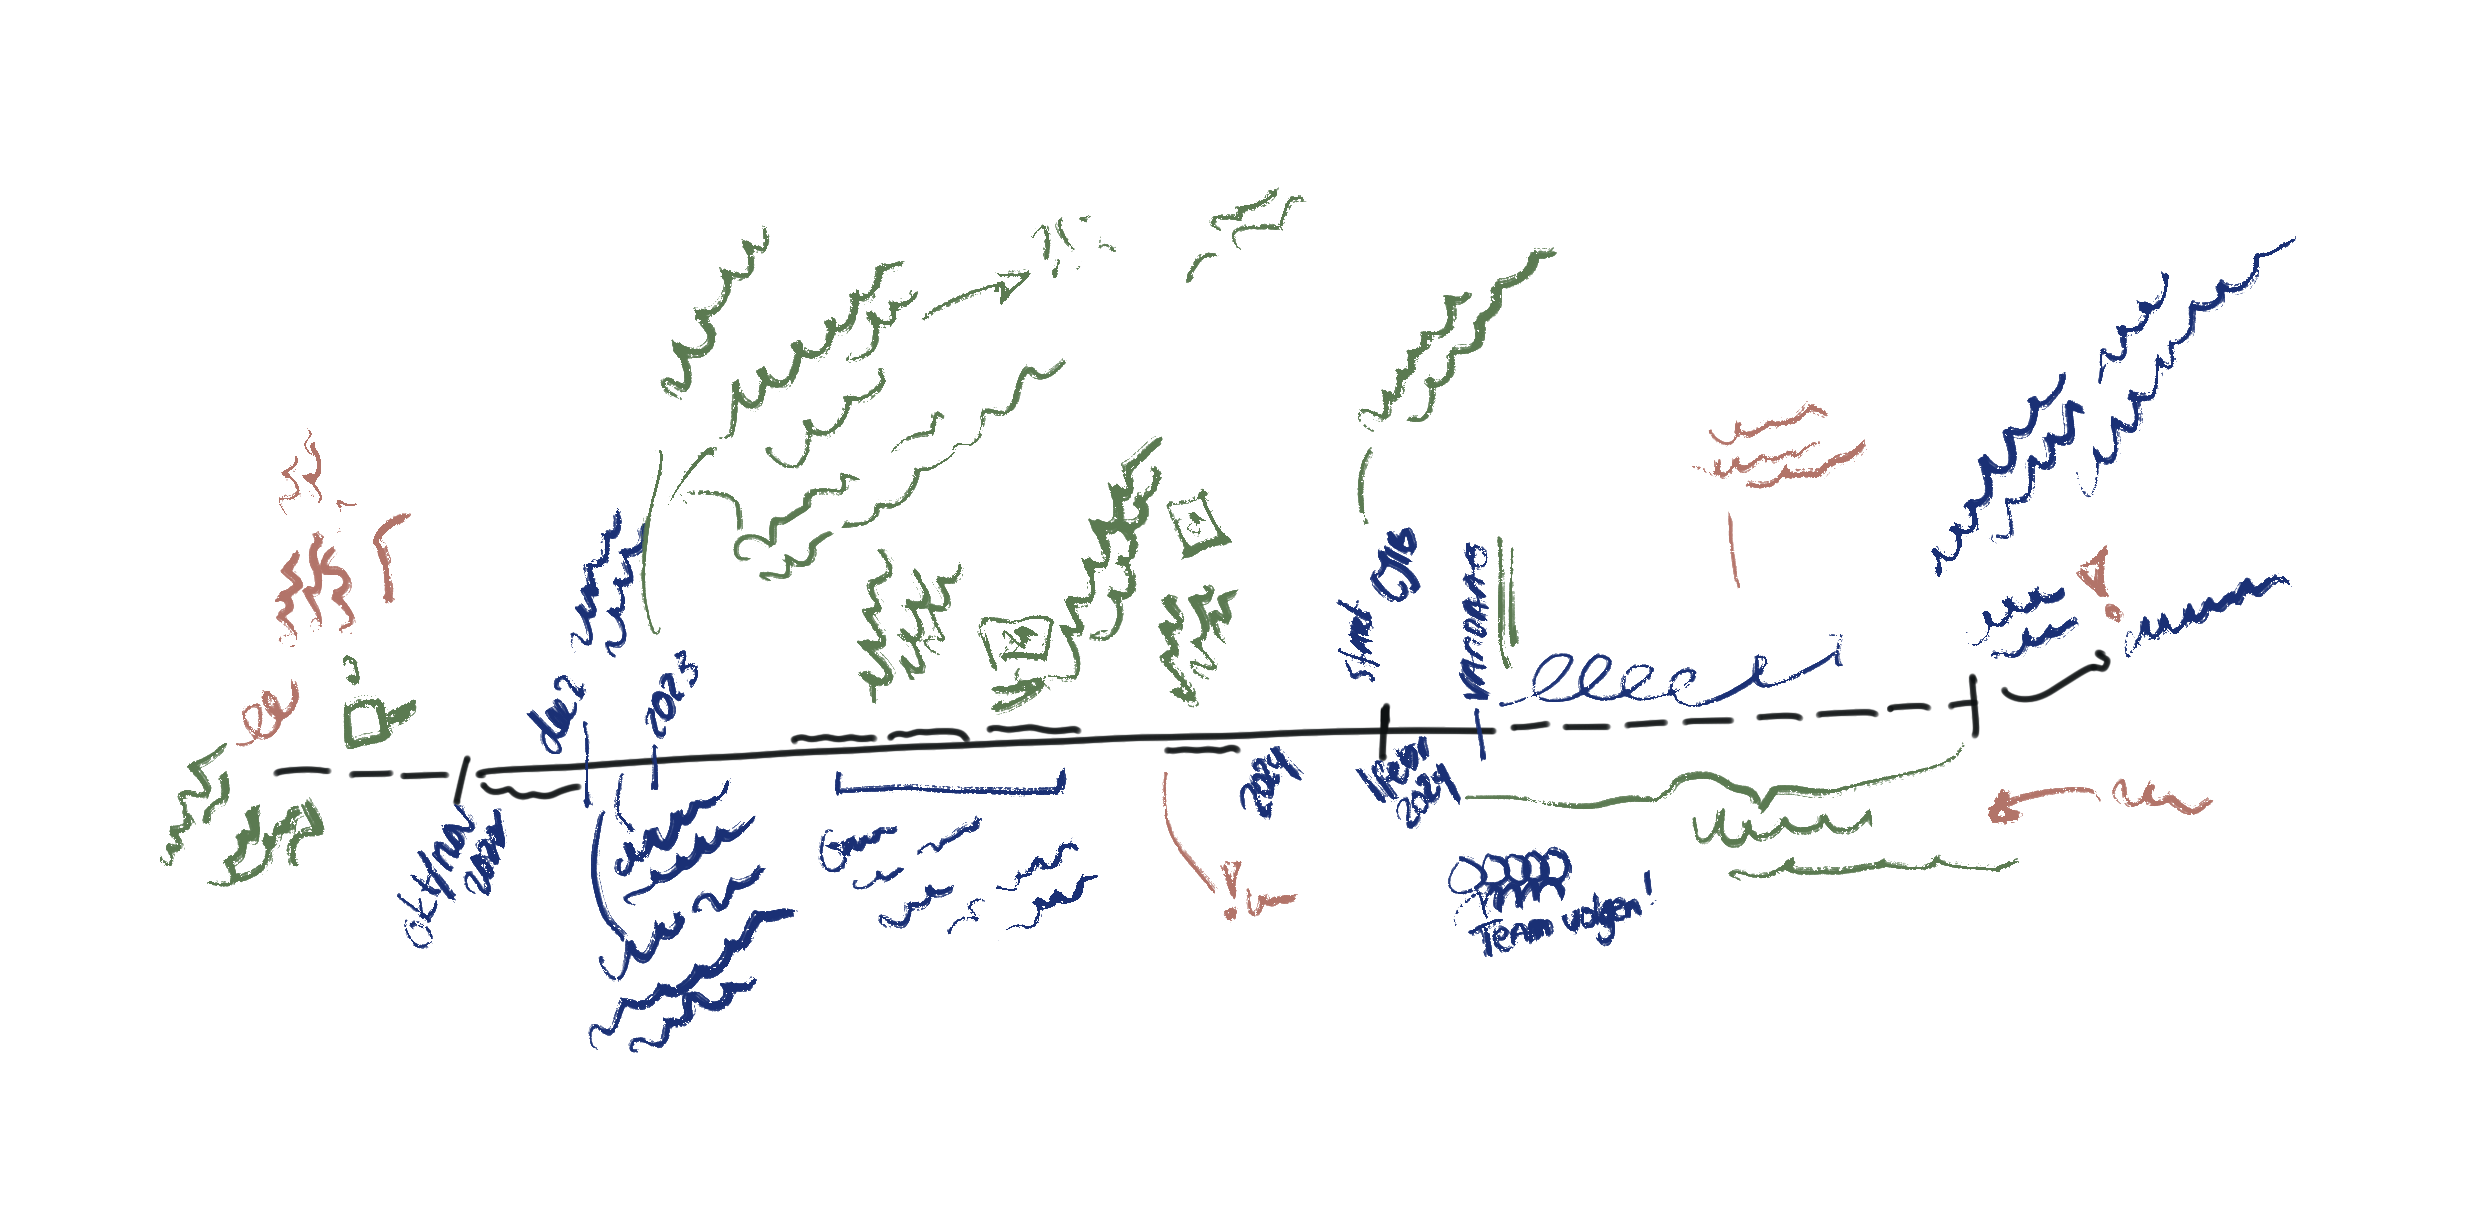
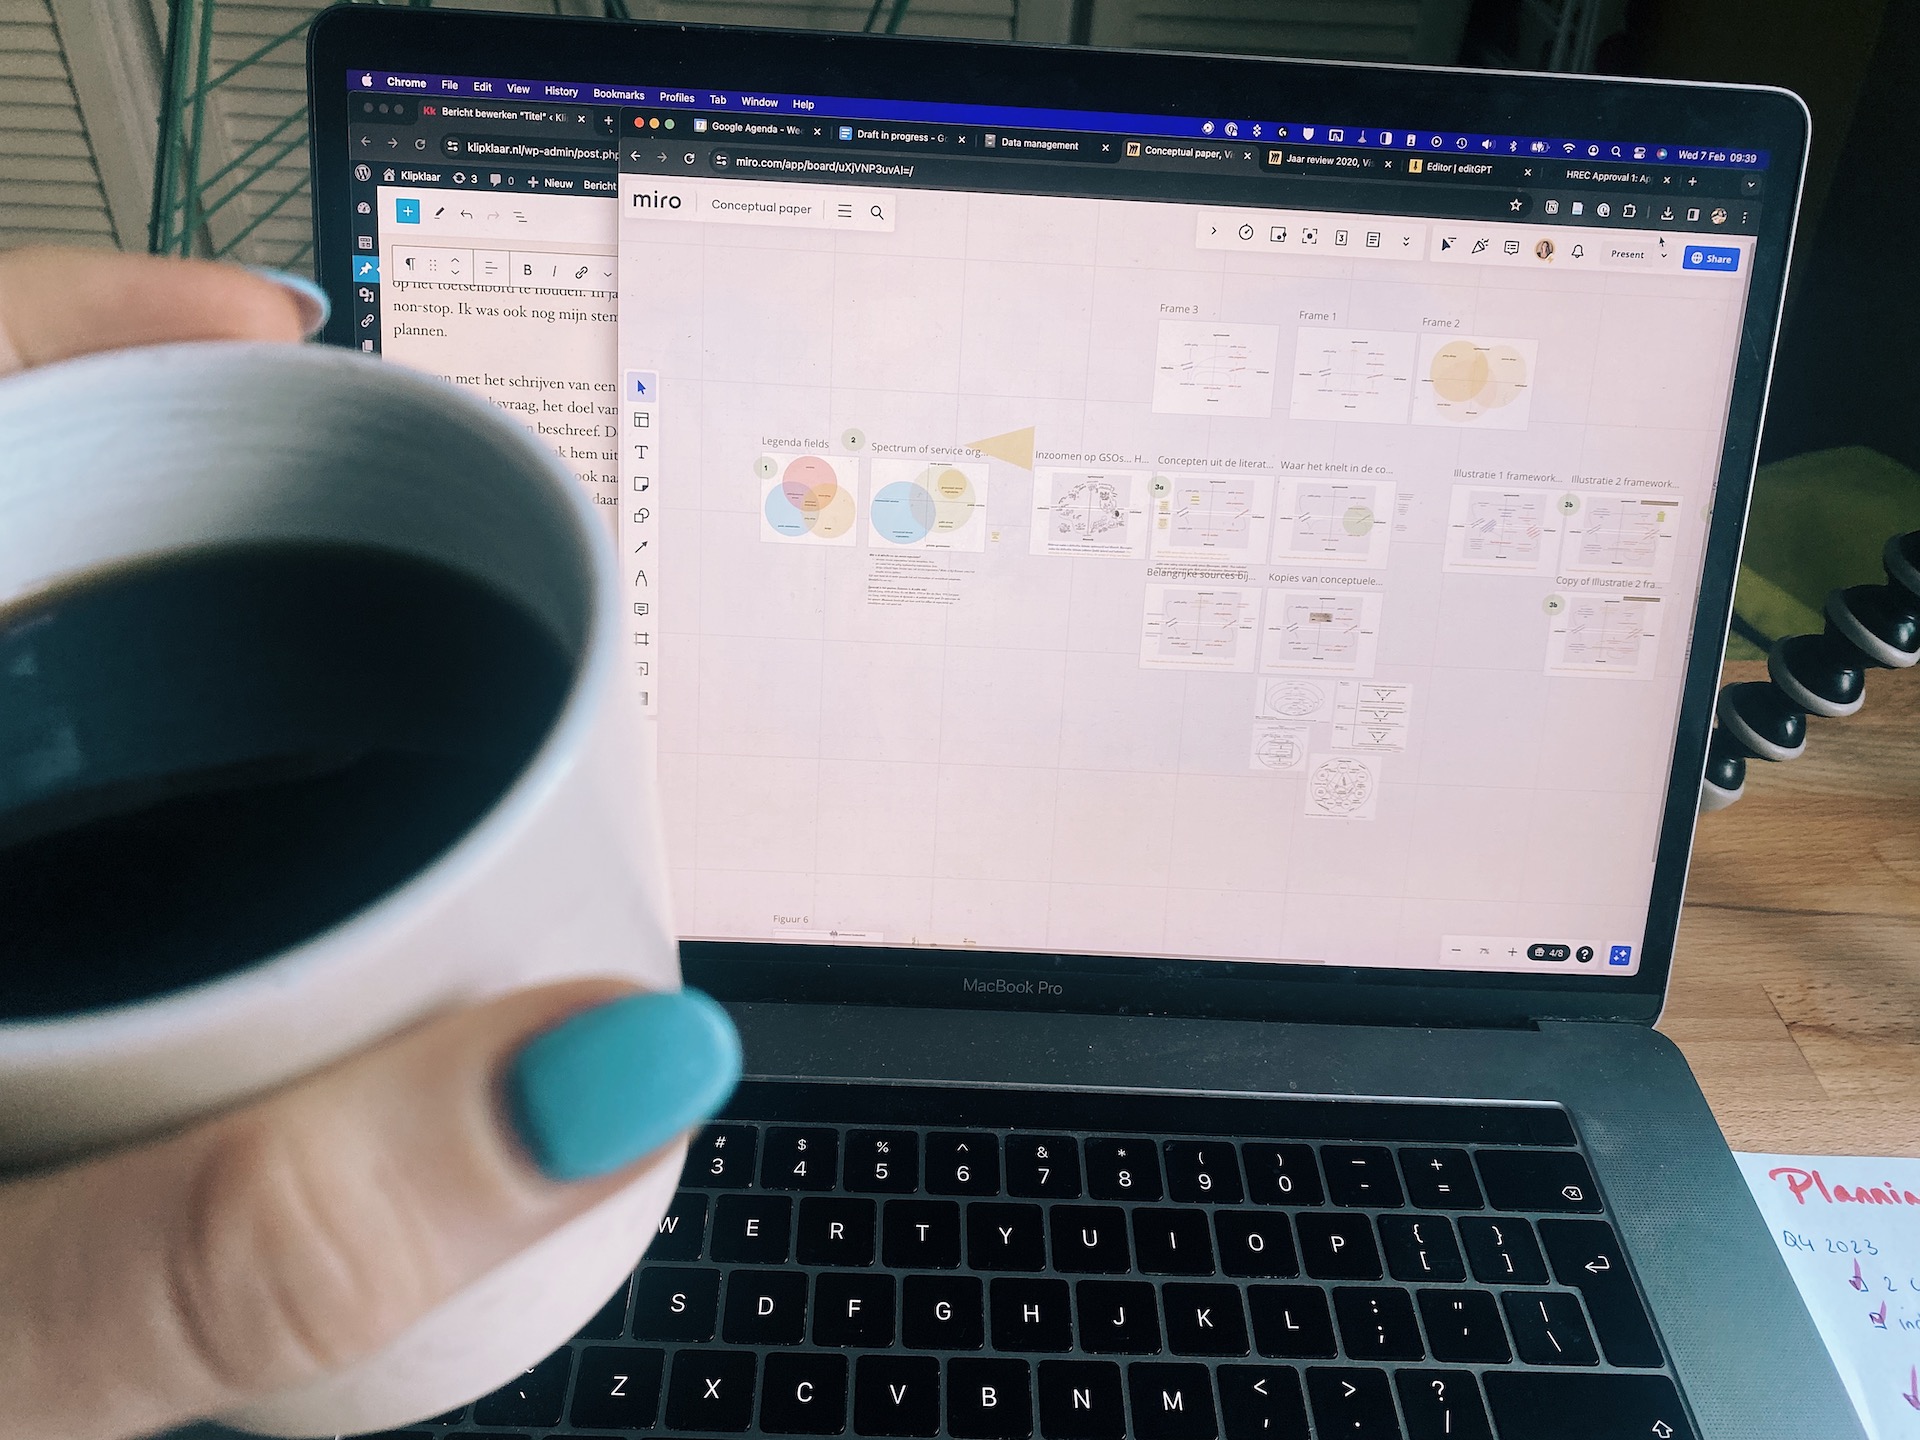
My research focuses on change, and this requires time. Therefore, I chose a process lens to look at all the data. I explain how this works in the blog Studying a process. It involves plotting my data on timelines to see the sequence of events and actions in order to find underlying mechanisms. This timeline approach is the first way I went through the data.
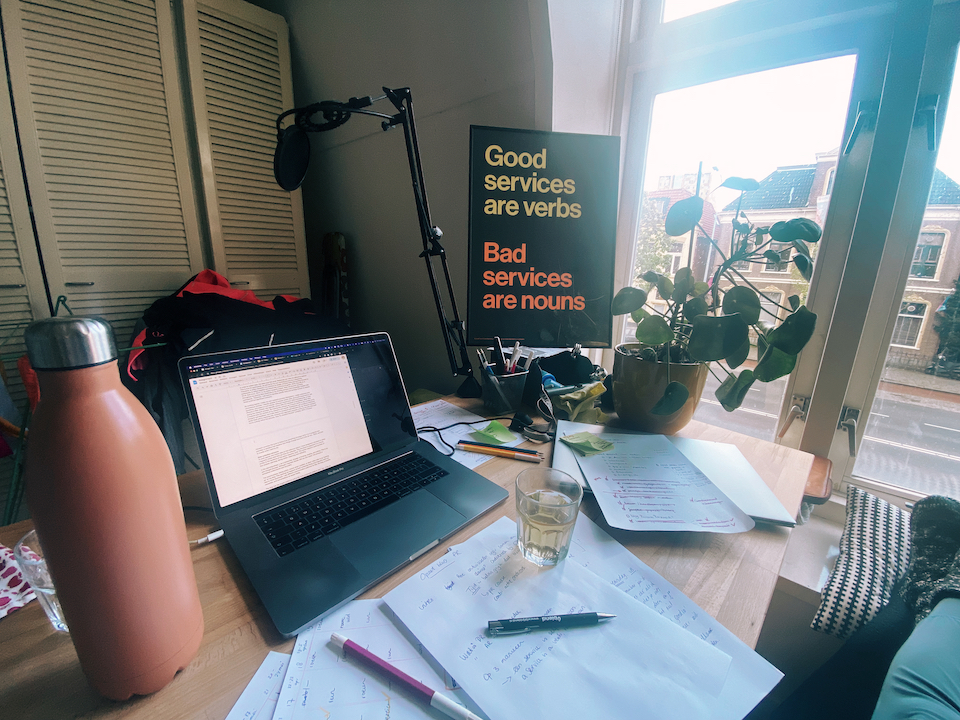
On the wall of my home office I made a large timeline of a few years on which I placed the defining moments of colleagues. I added stickers with their names when they talked about such a moment or period in their interview. Then I divided the timeline into periods that made sense to me.

One such period I experienced up close: the past six months. I made a detailed version of this by going through all my diaries and noting the important events per week. Events that I influenced got an extra black dot. Judging by the growth of the black dots, my role changed from passive observer to more active team member the longer I was involved in the program. That’s fine, and I’m glad I captured this so well and kept my reflections on it in the journal.
1988 unique codes
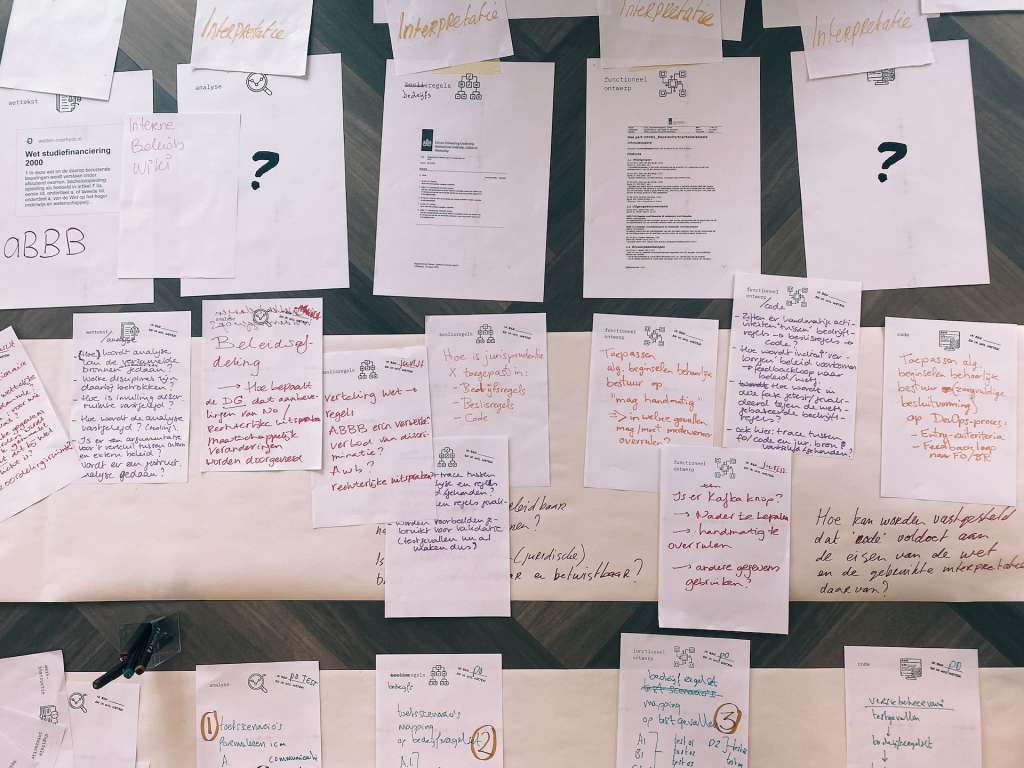
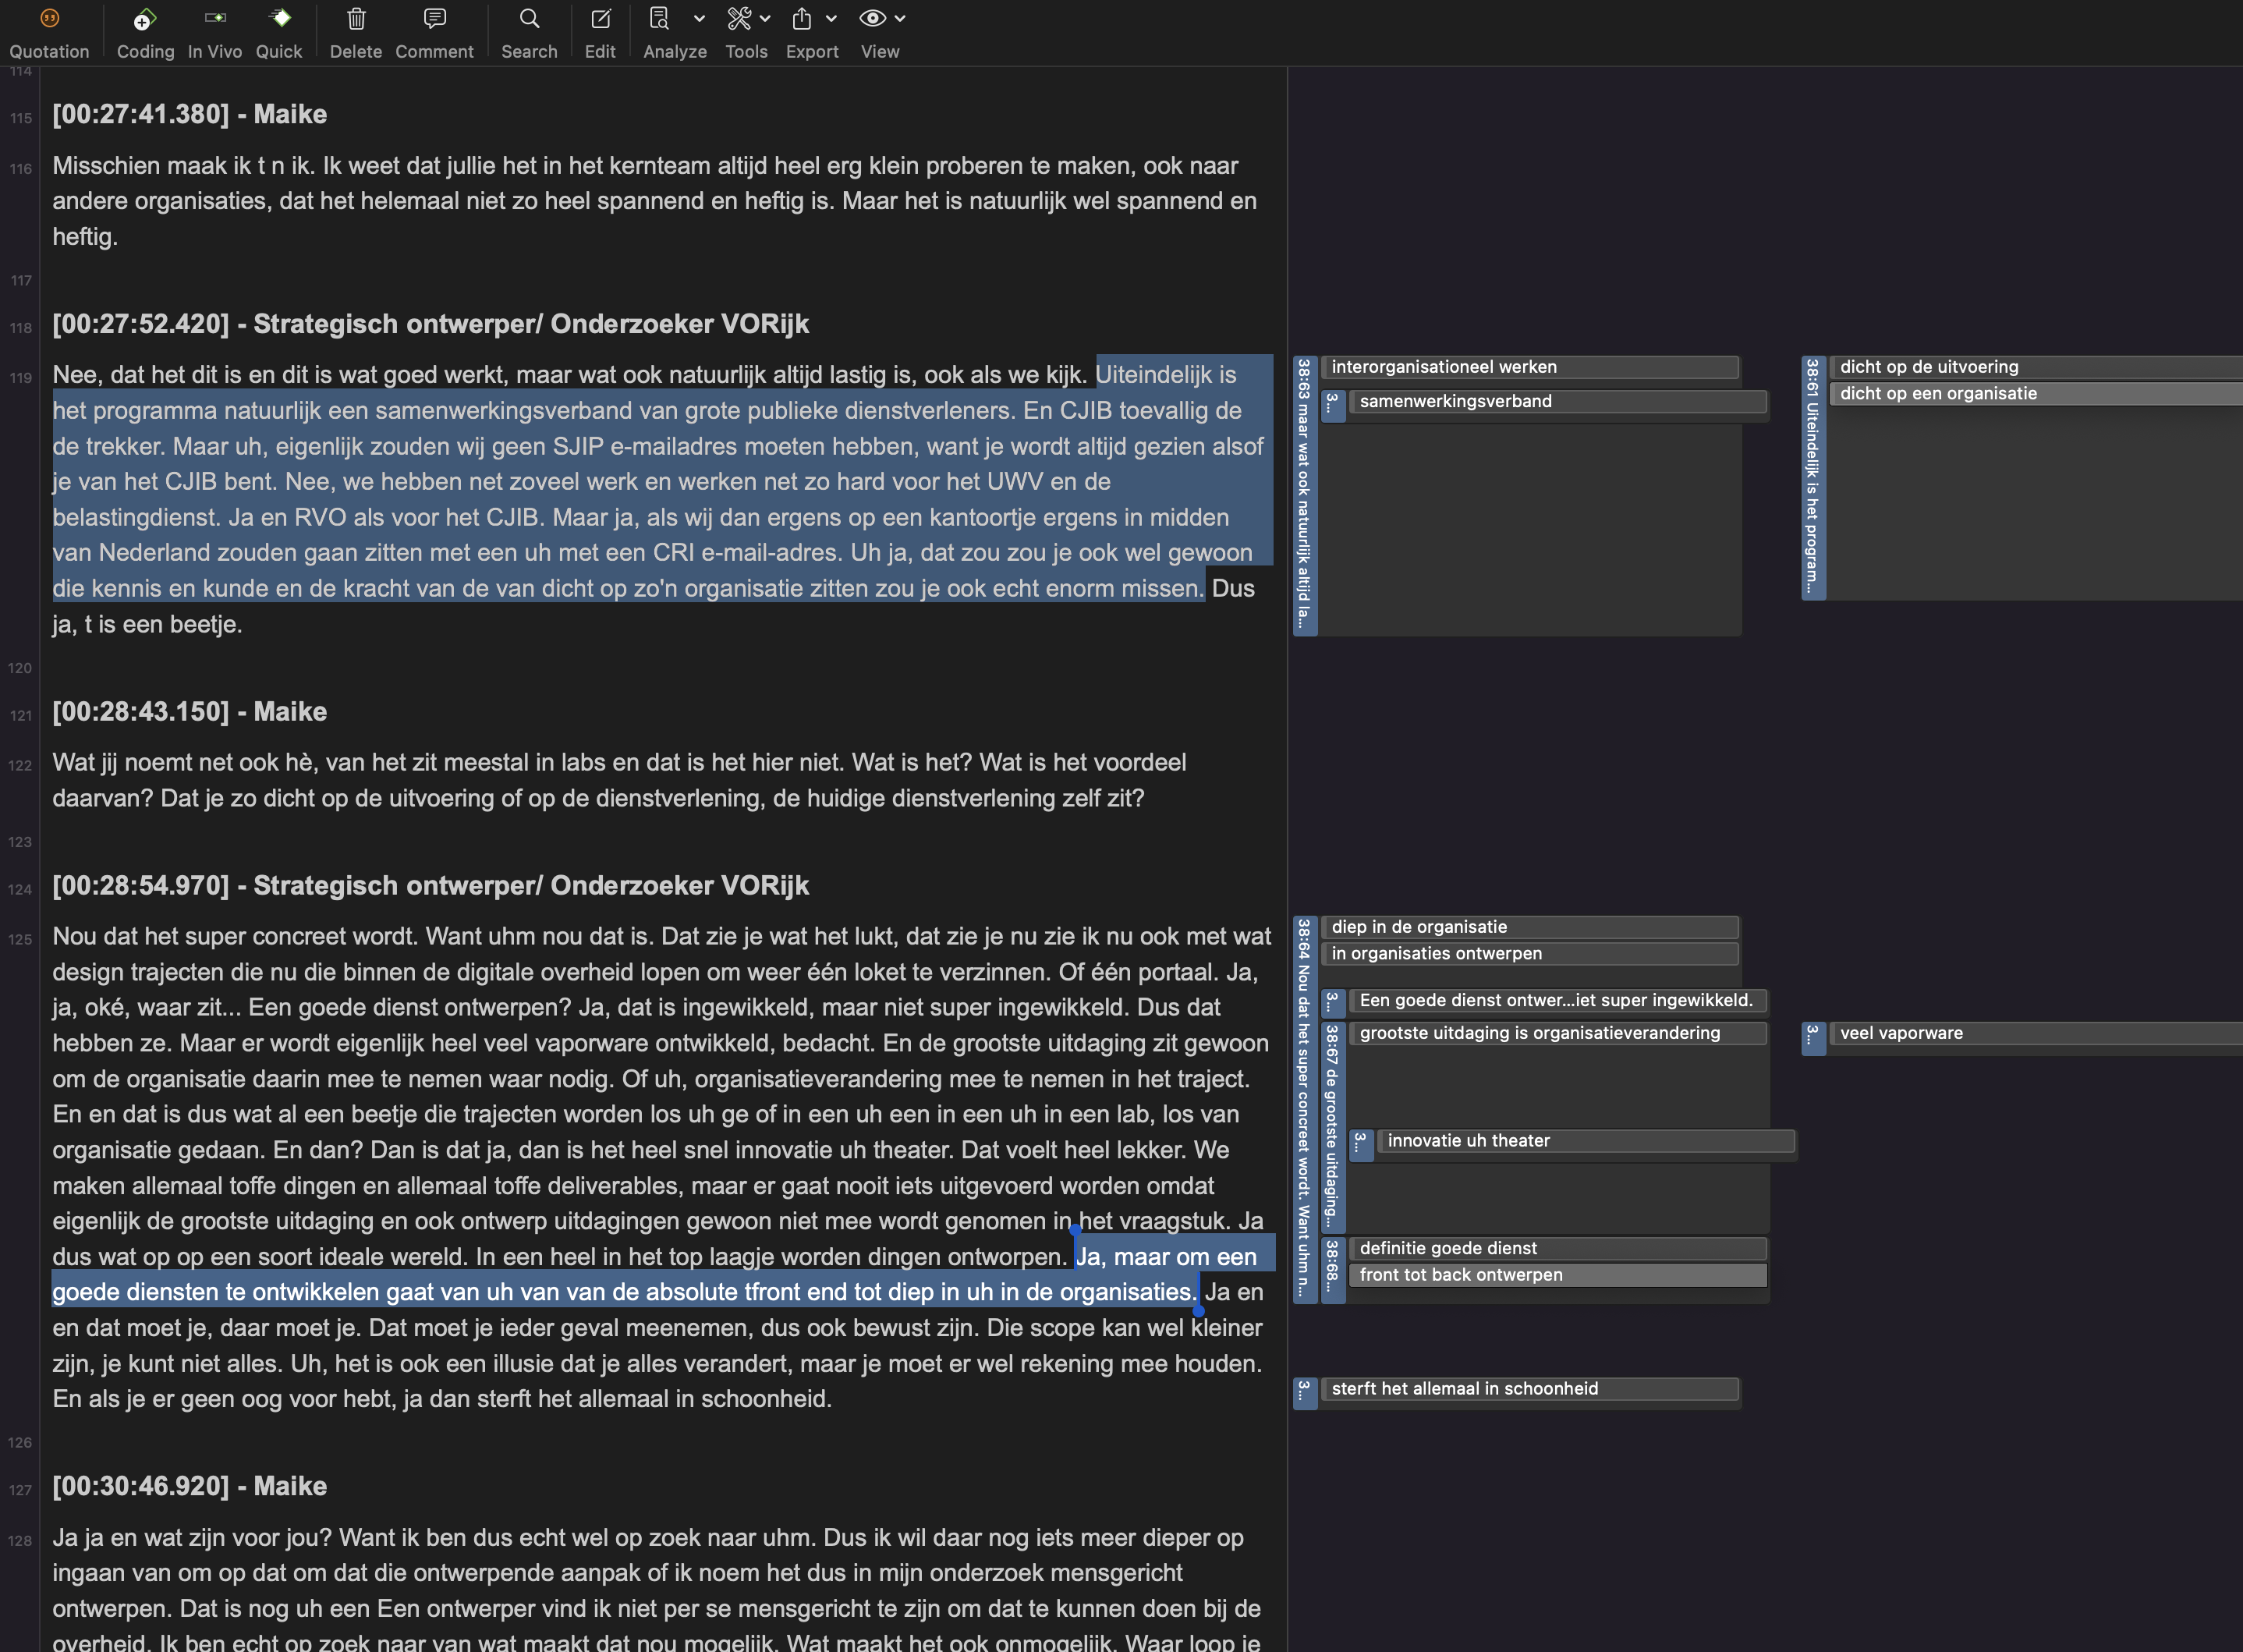
The second way I went through all the data is by encoding it. Almost all of my data consists of text. Even the visual data have been “translated” into text as colleagues talk about it in the group discussion and their interview.
Of the conversations I recorded in audio, I made a verbatim transcript. For some, that took some getting used to, because every um is in there. No one talks in neat full sentences. Often we search for words and come up with a new ending mid-sentence. I wanted to follow the thought processes and excursions. And I wanted to stay as close as possible to the exact wording of the participants.
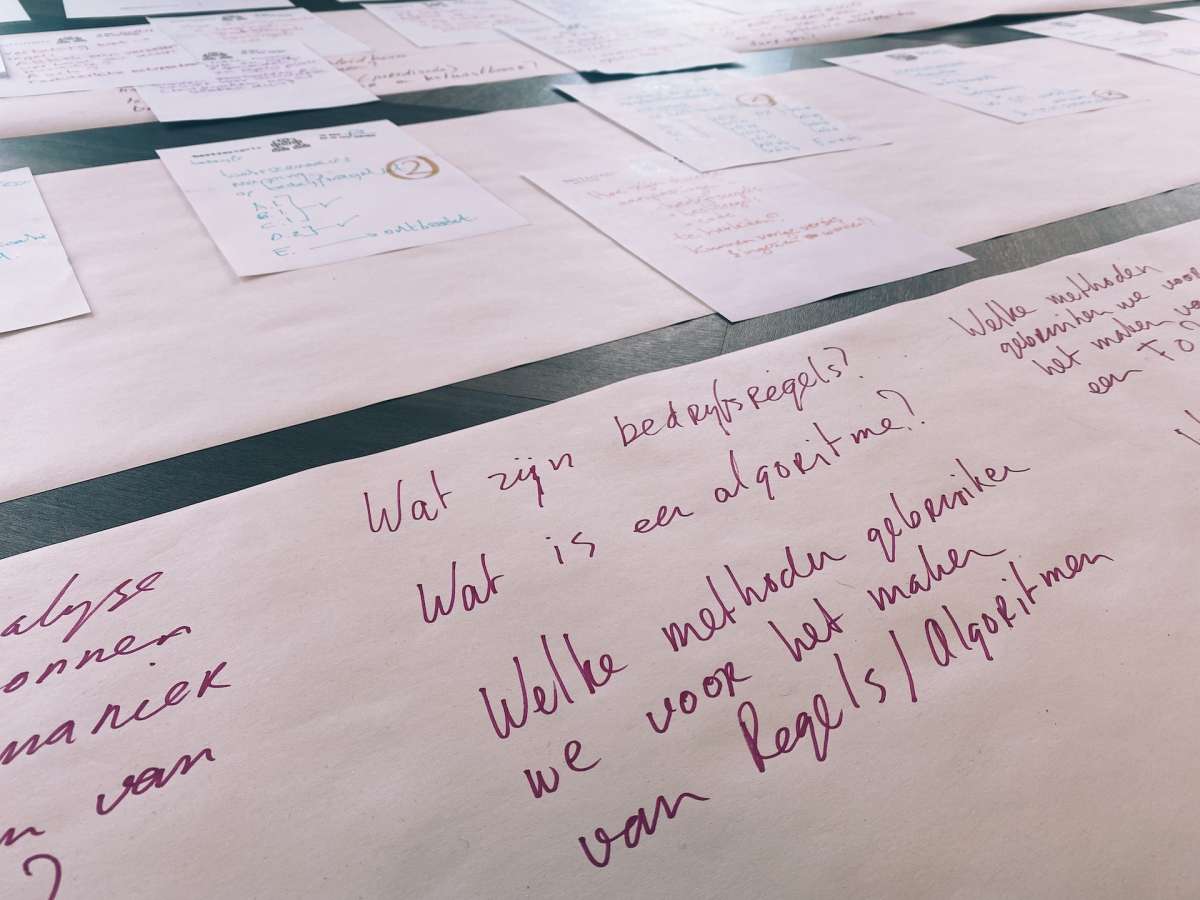
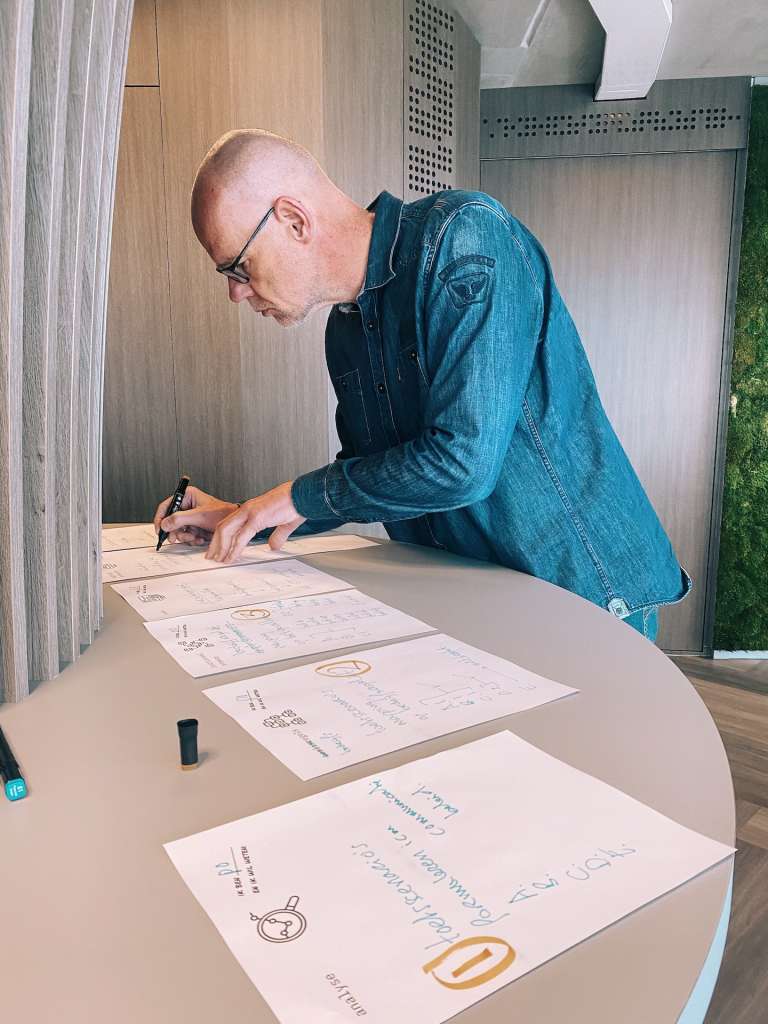
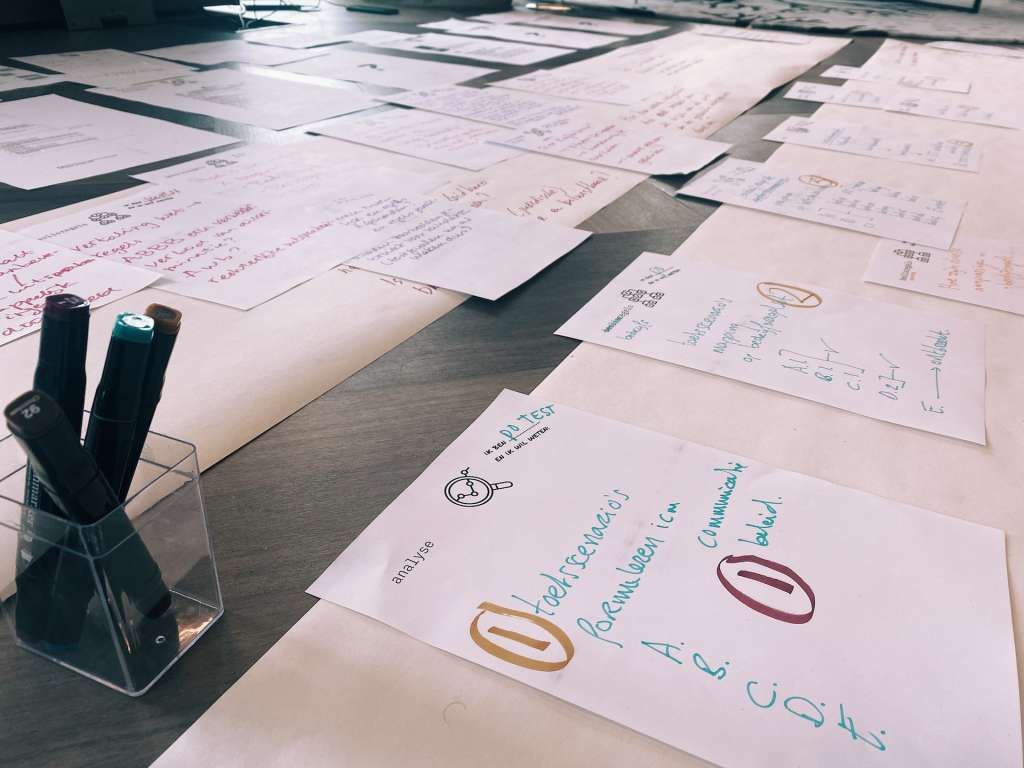
For coding all the data, I use ATLAS.ti. On their website they have a handy explanation of what coding in qualitative research entails. In short: I go through each piece of text to see what it is about. This I give a label, a code in other words. An average one-hour interview gave me 125 codes. In total, a first round of coding all the texts yielded 1988 unique codes.
While coding the texts, I was constantly thinking about my research question. So I paid attention to whether participants told how they made services. What processes are there and what steps do they consist of? Each step is given a code. Do they use design methods, and which of these are human-centered? Everything I encountered was given a code. What are they running into? And what exactly helps them? You get the point: a code!
In addition, I also coded a lot “en vivo. This means that you use the literal words of the participant as code. You do this when you want to stay as close to the data as possible. The reason I do this is that for designers outside government, government is often a closed world with its own language. To apply design in a public bureaucratic environment, we also need a common language. That’s why I don’t want to “translate” myself already while coding, but use the language of the government itself.
Examples of this type of en vivo codes that can be very instructive for designers:
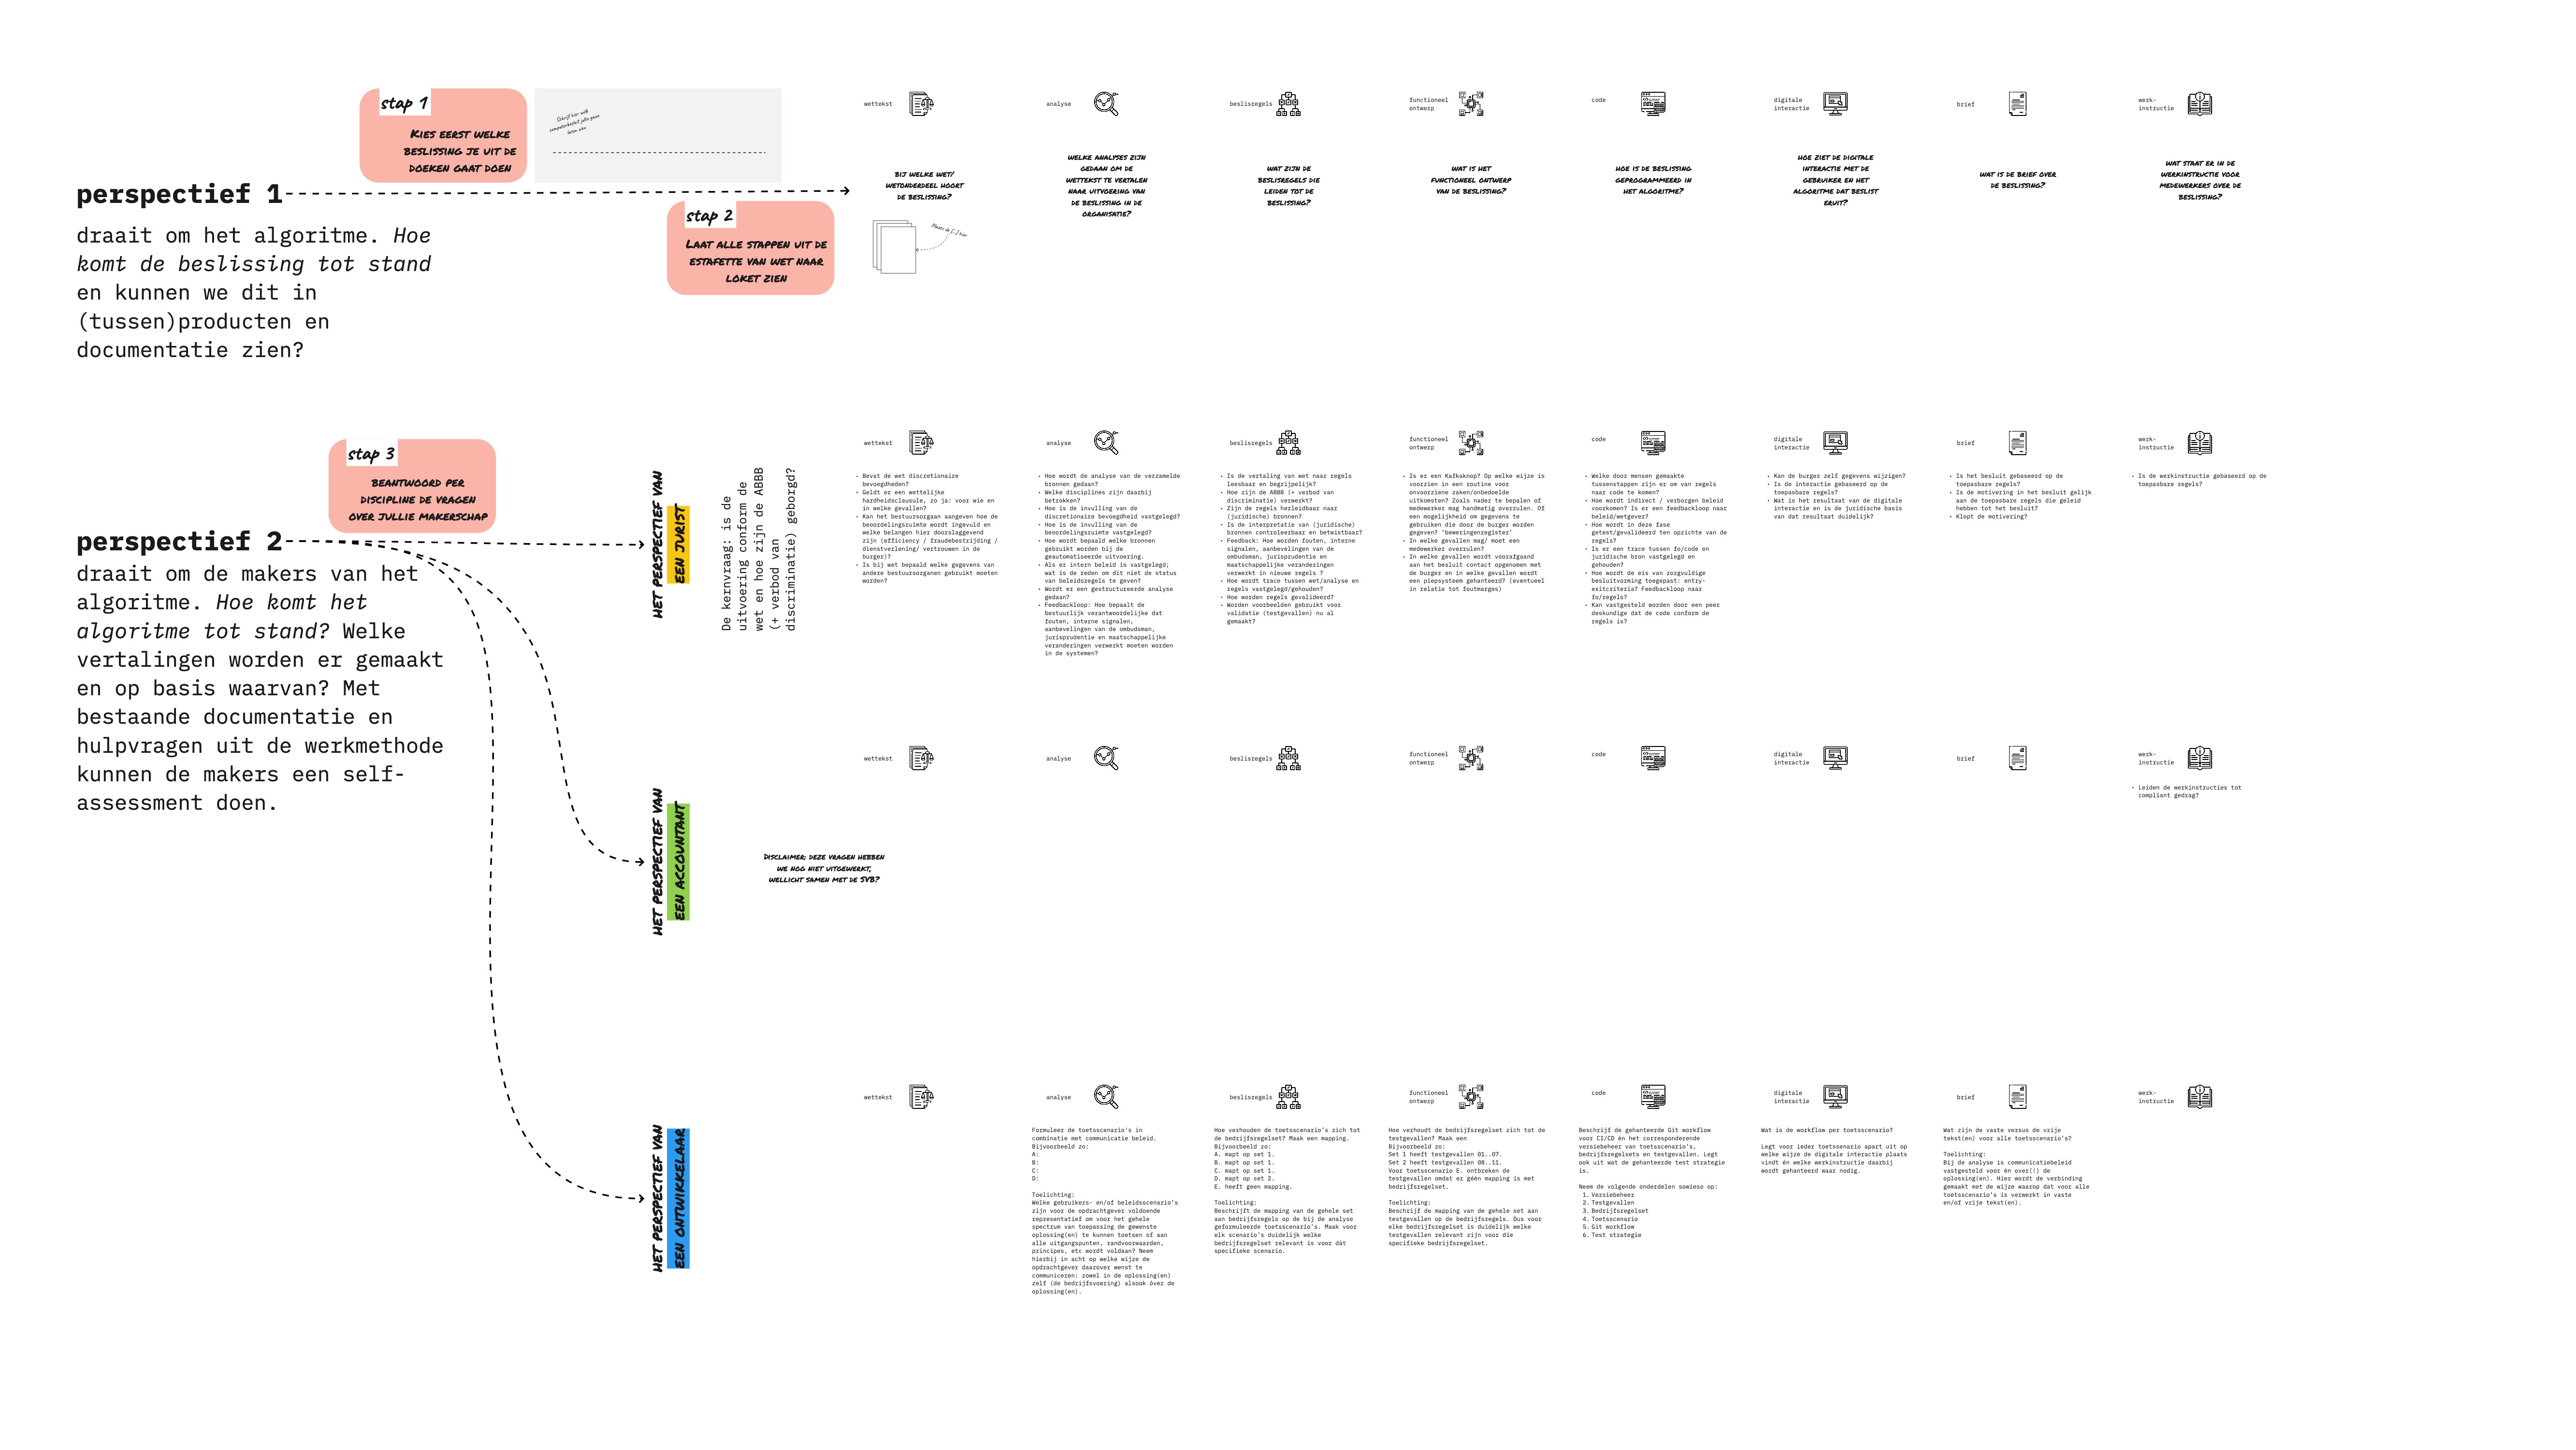
- An individual administrative decision: this is a term from the General Administrative Law Act. It is an official legal decision that an organization has a legal mandate to make. For example, the decision that you are not entitled to an allowance and must pay it back. You can object and appeal against a decision. These are measures of legal protection for citizens. Such a decision is a core part of a government service.
- A front portal: a type of meeting in which decisions are prepared by officials. There can be all sorts of different types of front portals. Sometimes a decision has to go through several tables and therefore through several front portals to those tables. Especially if different organizations have to decide something.
- the Minister’s bag: every weekend the minister is given the so-called weekend bag with memos for information or with something that needs to be decided. For civil servants, this bag represents a kind of deadline you work toward.
These en vivo codes can be combined to form a category, for example, a category describing how government decision-making works when you redesign services. Or a category on the legal aspects of service delivery. Some codes can also belong to both categories. This is something I’m going to work out over the rest of the summer. Then in a codebook, I’ll keep track of what main categories I have and what their definitions are. This will also allow me to start with a preliminary answer to my 2 questions: how do these organizations make a service together, and what helps and hinders them in designing it human-centered?
So how to proceed?
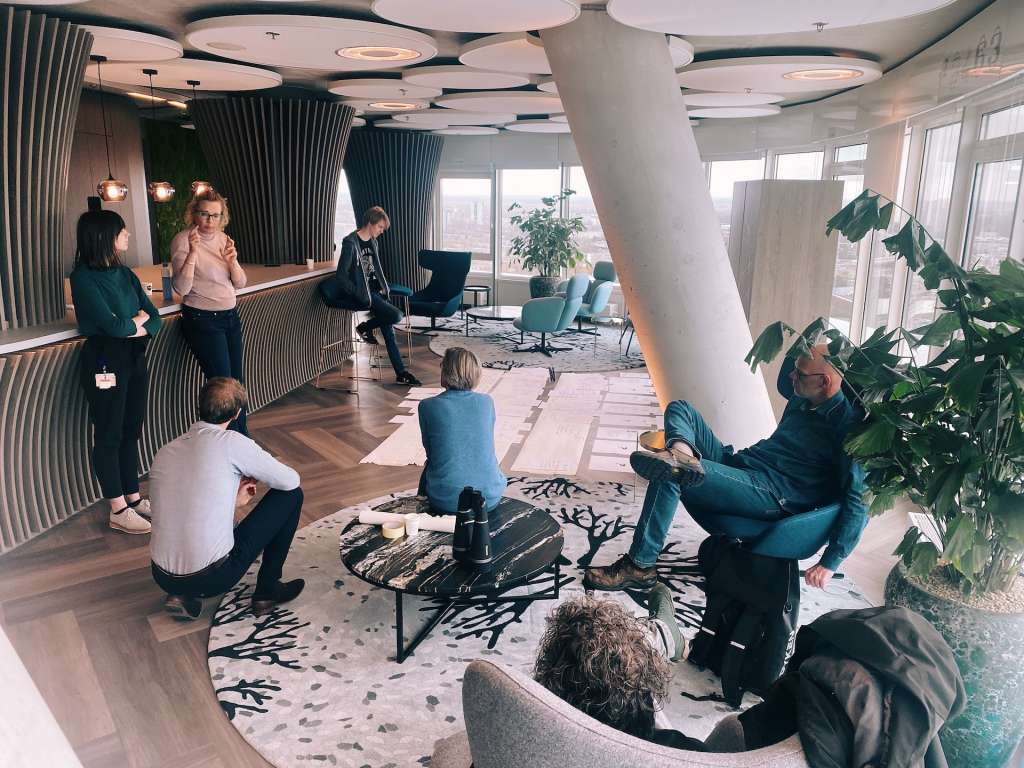
In early September, I will first discuss all the insights with the participants who participated. In qualitative research, this is called the member check. This is a crucial step in action research because you are working with participants in their own context. Do they recognize my preliminary answers? Do they have additions? Have I overlooked anything? At the same time, this is also an intervention because we reflect together on our way of working. This influences how the research will proceed. What do they see as the next step? We also discuss this together.
Are you also curious about the first insights? On September 12 in The Hague, I get to talk a little about my research at an event hosted by PONT with Kustaw Bessems of the podcast Stuurloos. You can sign up here!
Continue reading?
- Coghlan, D. (2019). Doing Action Research in Your Own Organization. Sage.
- Miles, M. B., Huberman, A. M. (1994). Qualitative data analysis: An expanded sourcebook. Sage.
- Saldaña, J. (2021). The coding manual for qualitative researchers. Sage.
- Small, M. L., Calarco, J. M. (2022). Qualitative literacy: A guide to evaluating ethnographic and interview research. Univ of California Press.