Yesterday, people from all over sent me a job posting for a PhD position at the Benefits Service. It felt like I was reading my own job description! I started my PhD research in 2022 as a civil servant, focusing on how the government can create services that benefit people—specifically, in how it collects debt.
I do know other civil servants who are also pursuing a Ph.D., but what makes this position—and, let’s face it, my job—special is that the research isn’t something you do on the side; it’s actually your job in practice. That’s valuable for the government (the ability to drive change and gain new insights), for science (unique access to data), and for the Ph.D. candidate themselves (a unique learning experience).
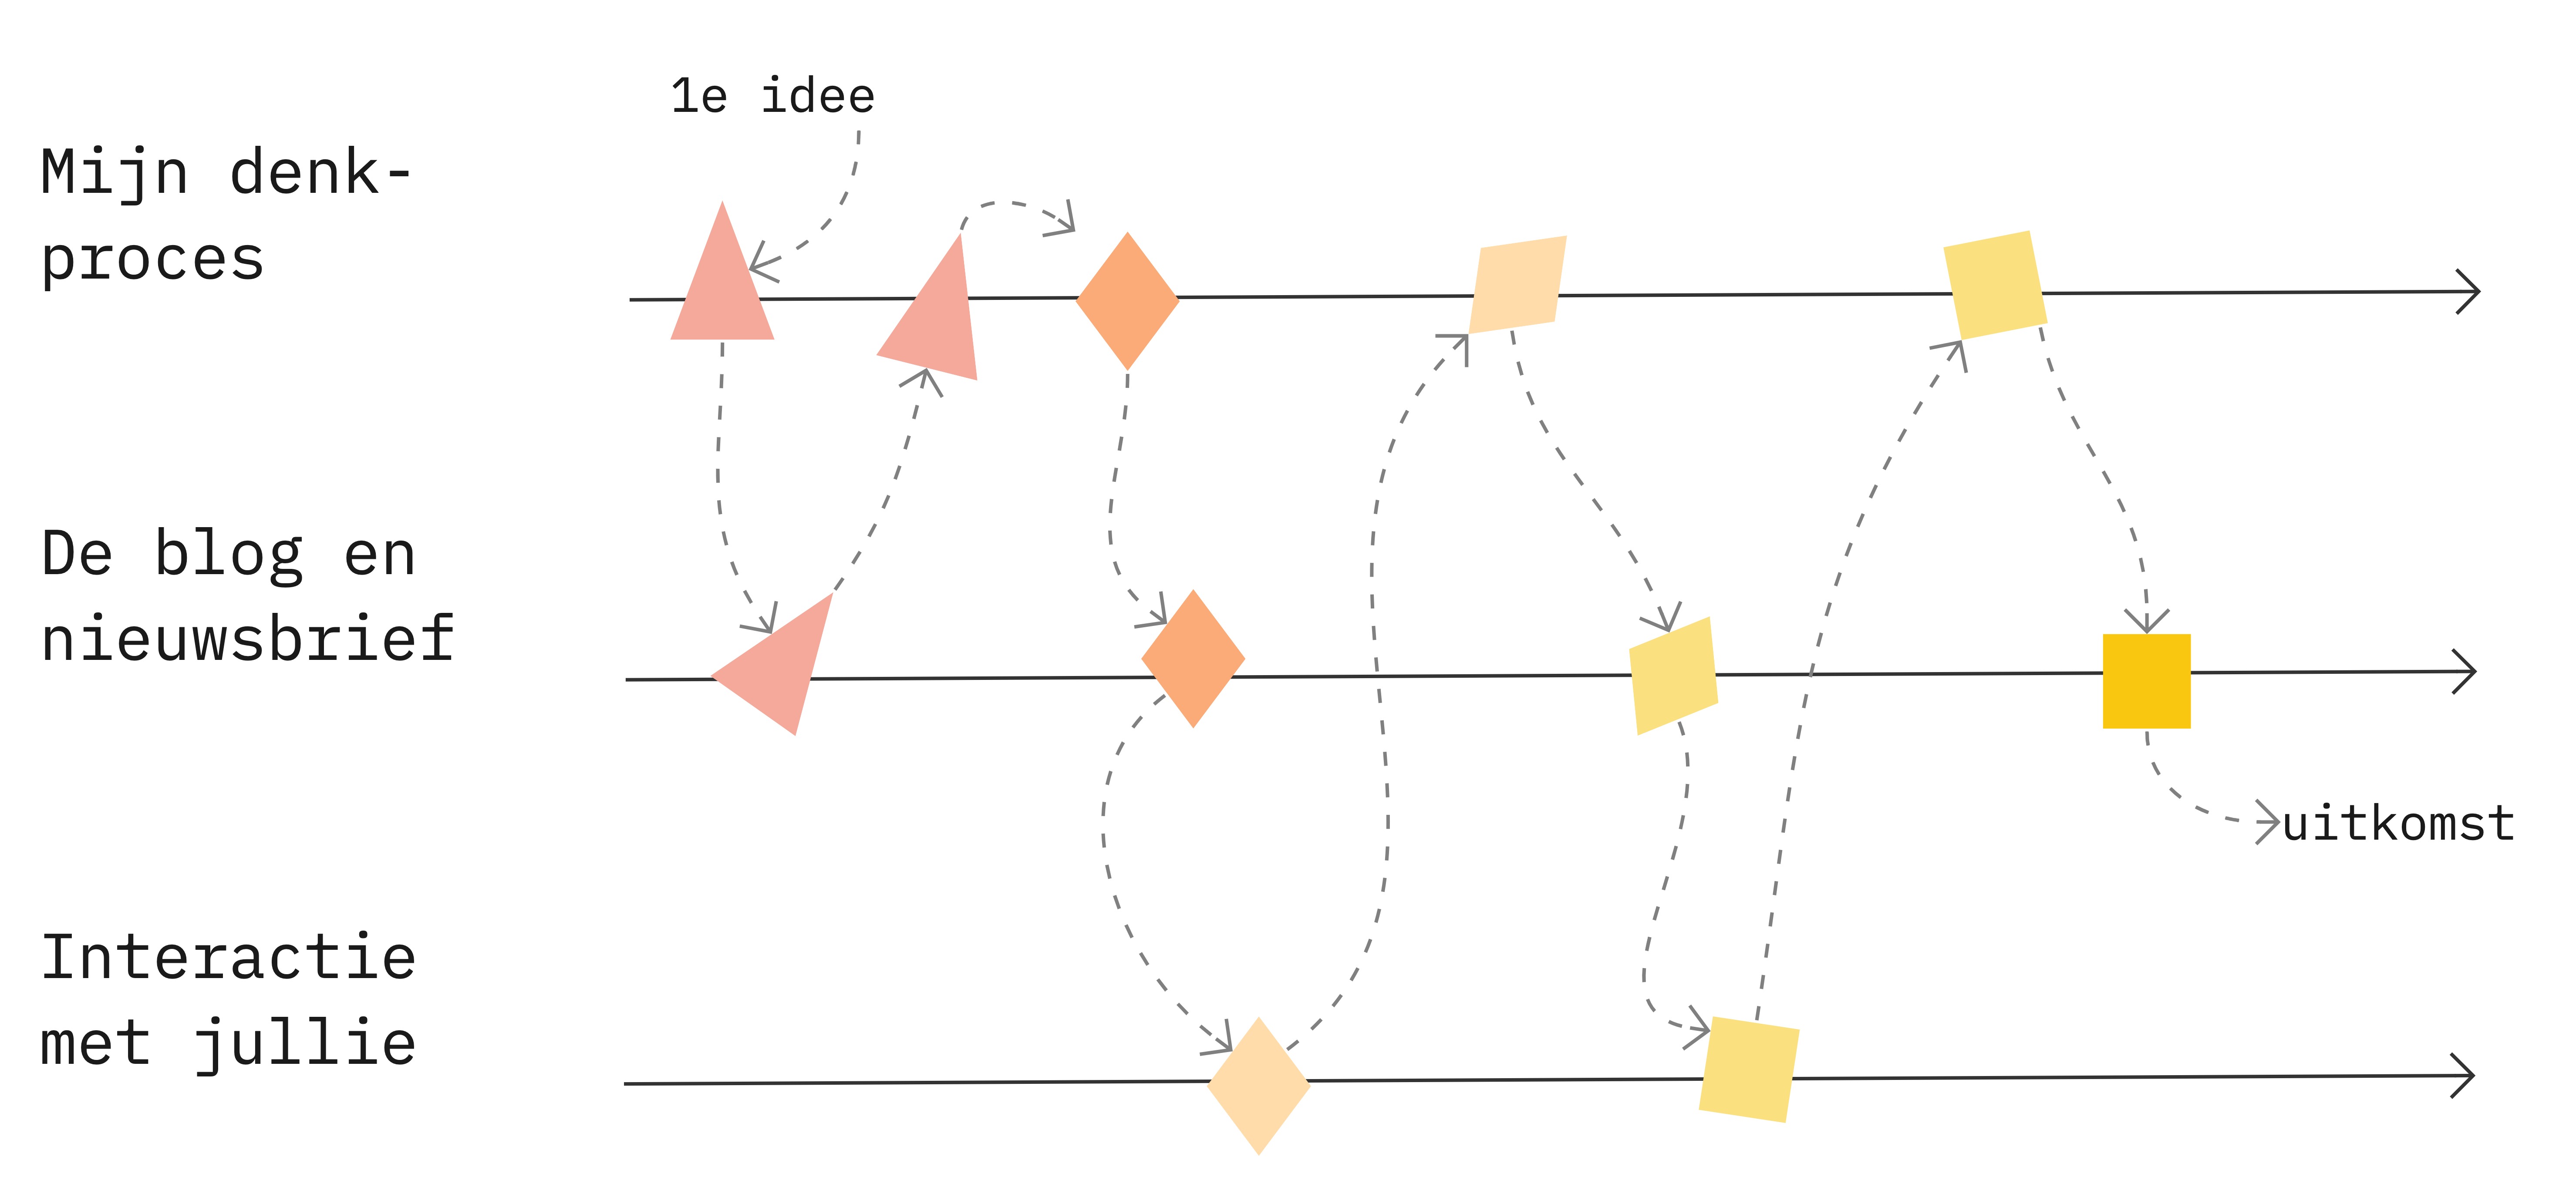
I’ve been working on my research for three years now. Not through a job posting, but by pitching my own proposal and teaming up with DUO and CJIB. You can read all about it on this blog. I see this as a tremendous opportunity, so here are a few tips for anyone who’s interested in this position—or similar ones in the future.
Want an update in your mailbox every month about my research? Then subscribe to my newsletter.
A Catalyst for Change
I already noticed this during my master’s research: some issues are difficult to bring up within an organization. Sometimes it’s even impossible to bring them to light. But as soon as an external institution is involved, and you, as a researcher, also have academic obligations, something changes.
It lends legitimacy. You can ask questions that might otherwise be too sensitive. You’re given the space to reflect on issues that would otherwise be swept under the rug. And you can bring up topics that are important to citizens but that often don’t receive the highest priority amid the hustle and bustle of daily life. So that academic perspective not only helps you conduct in-depth research but also opens doors.
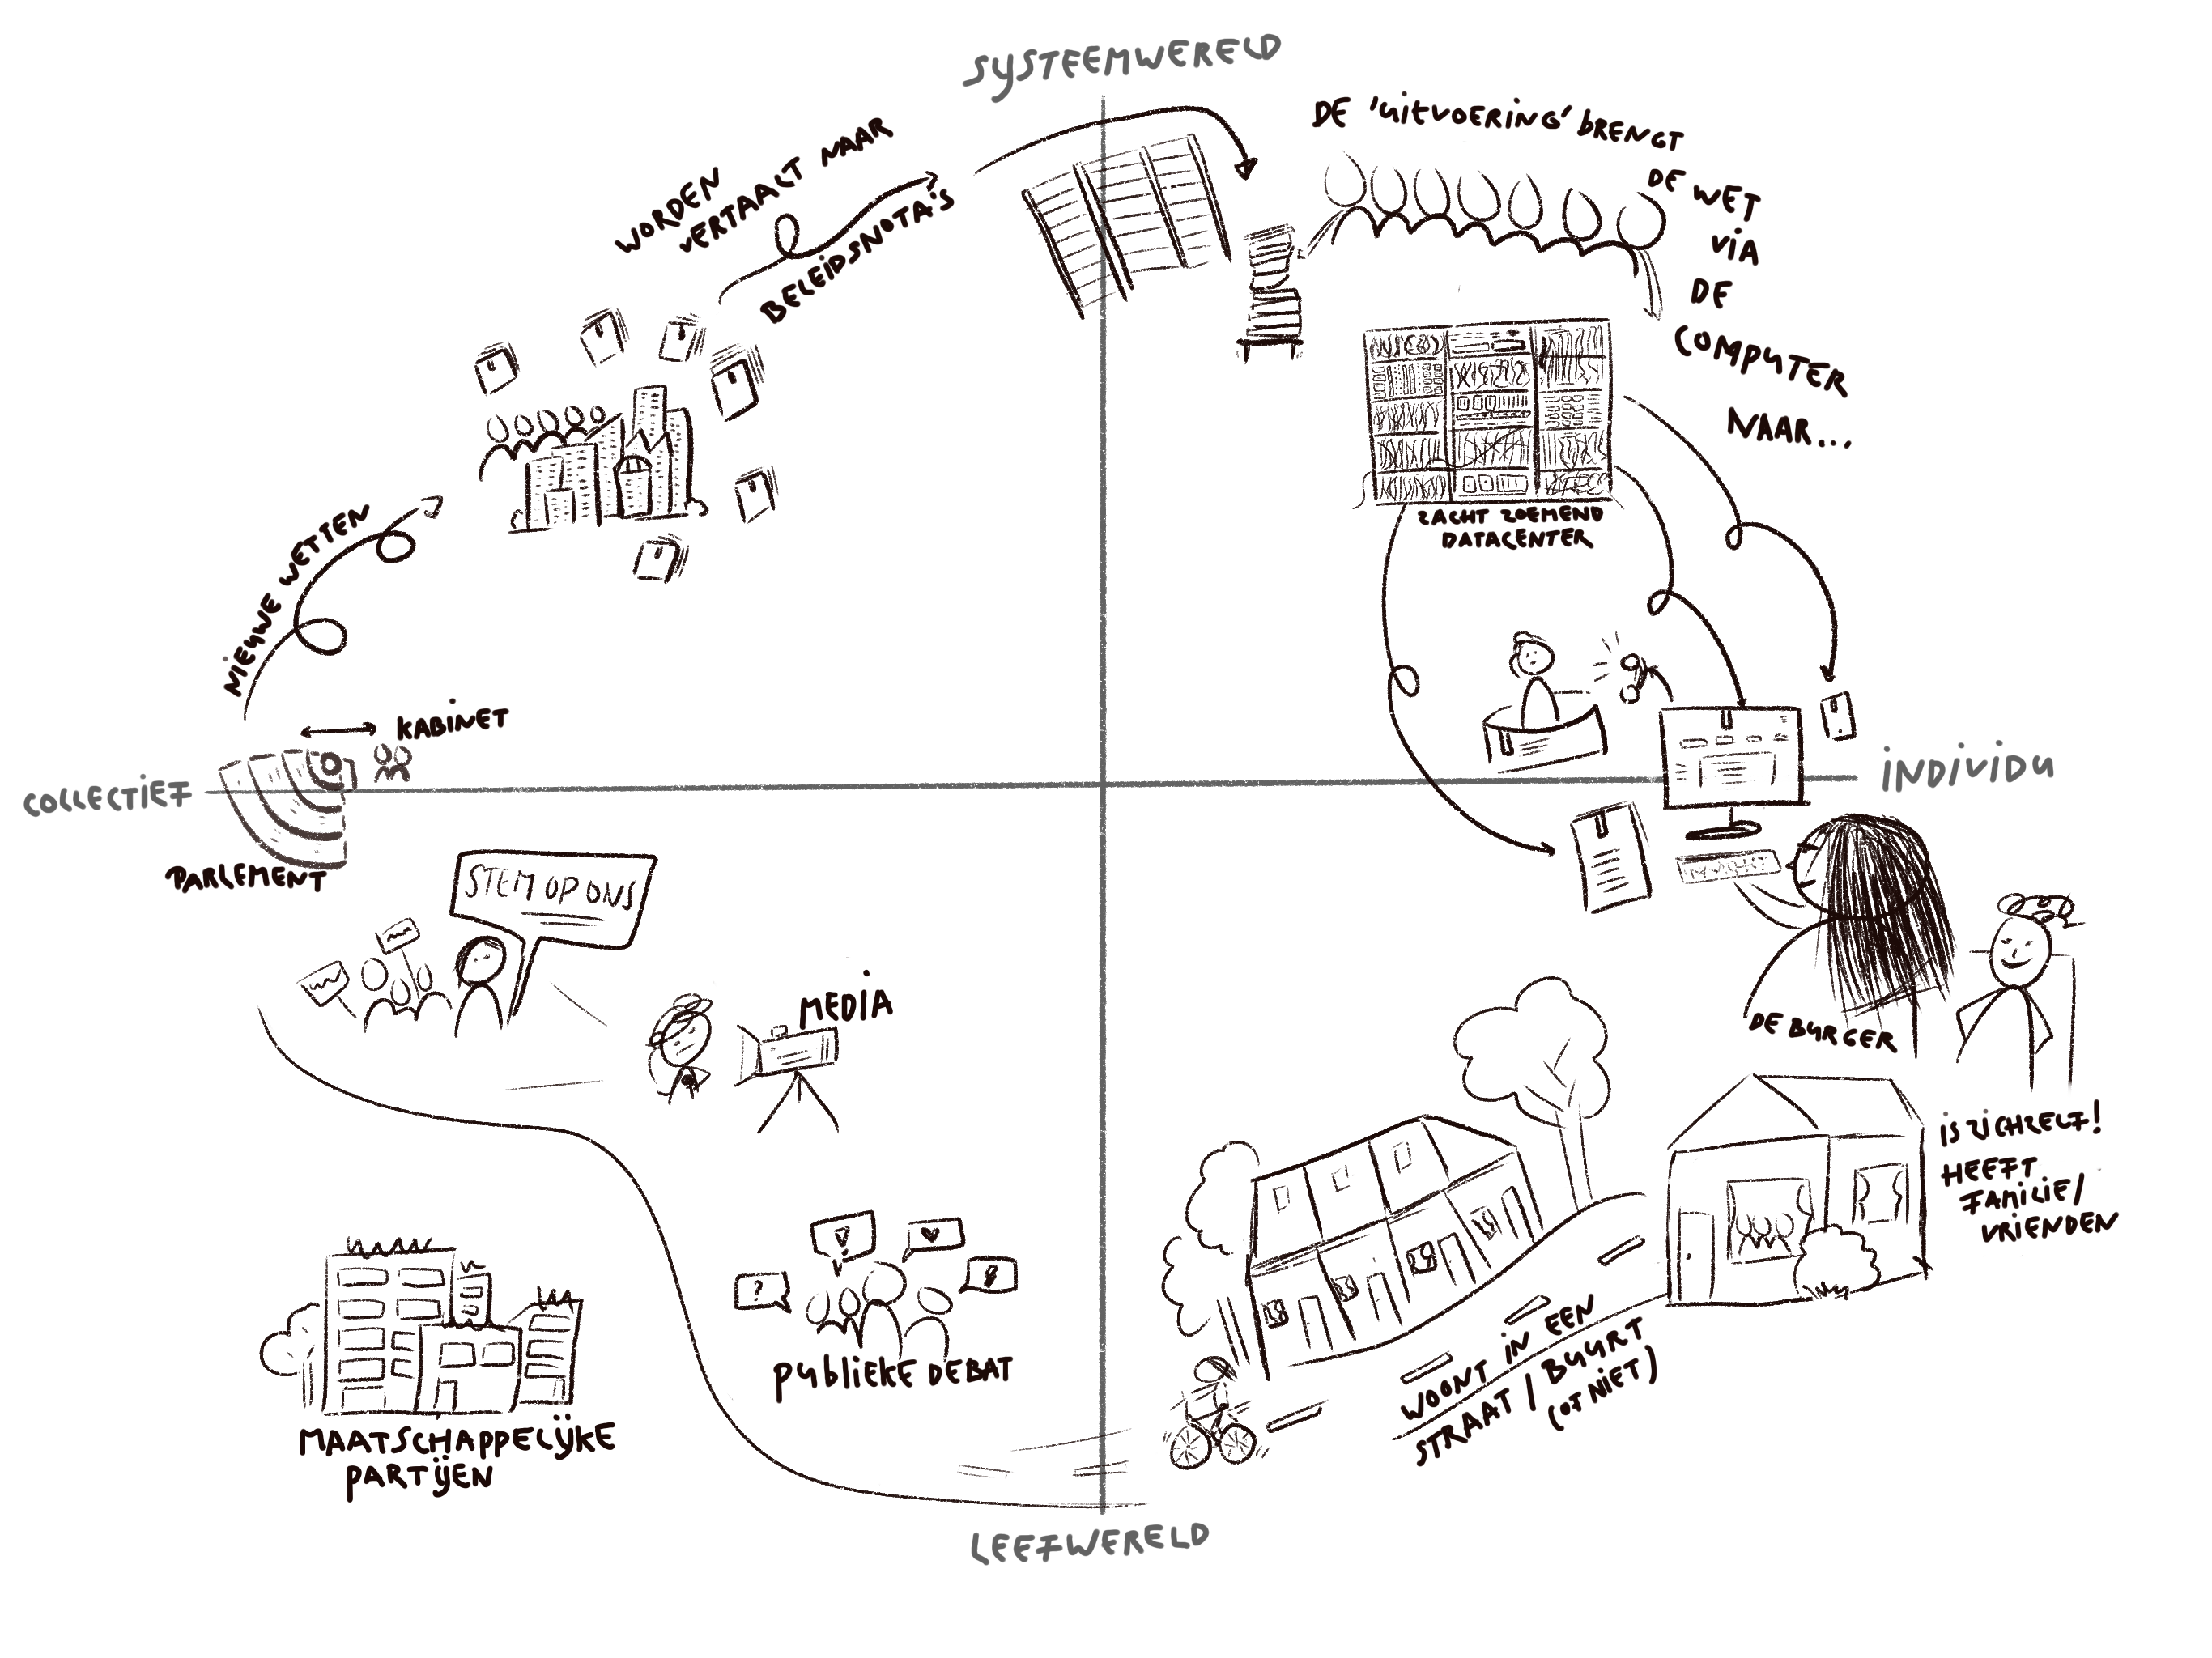
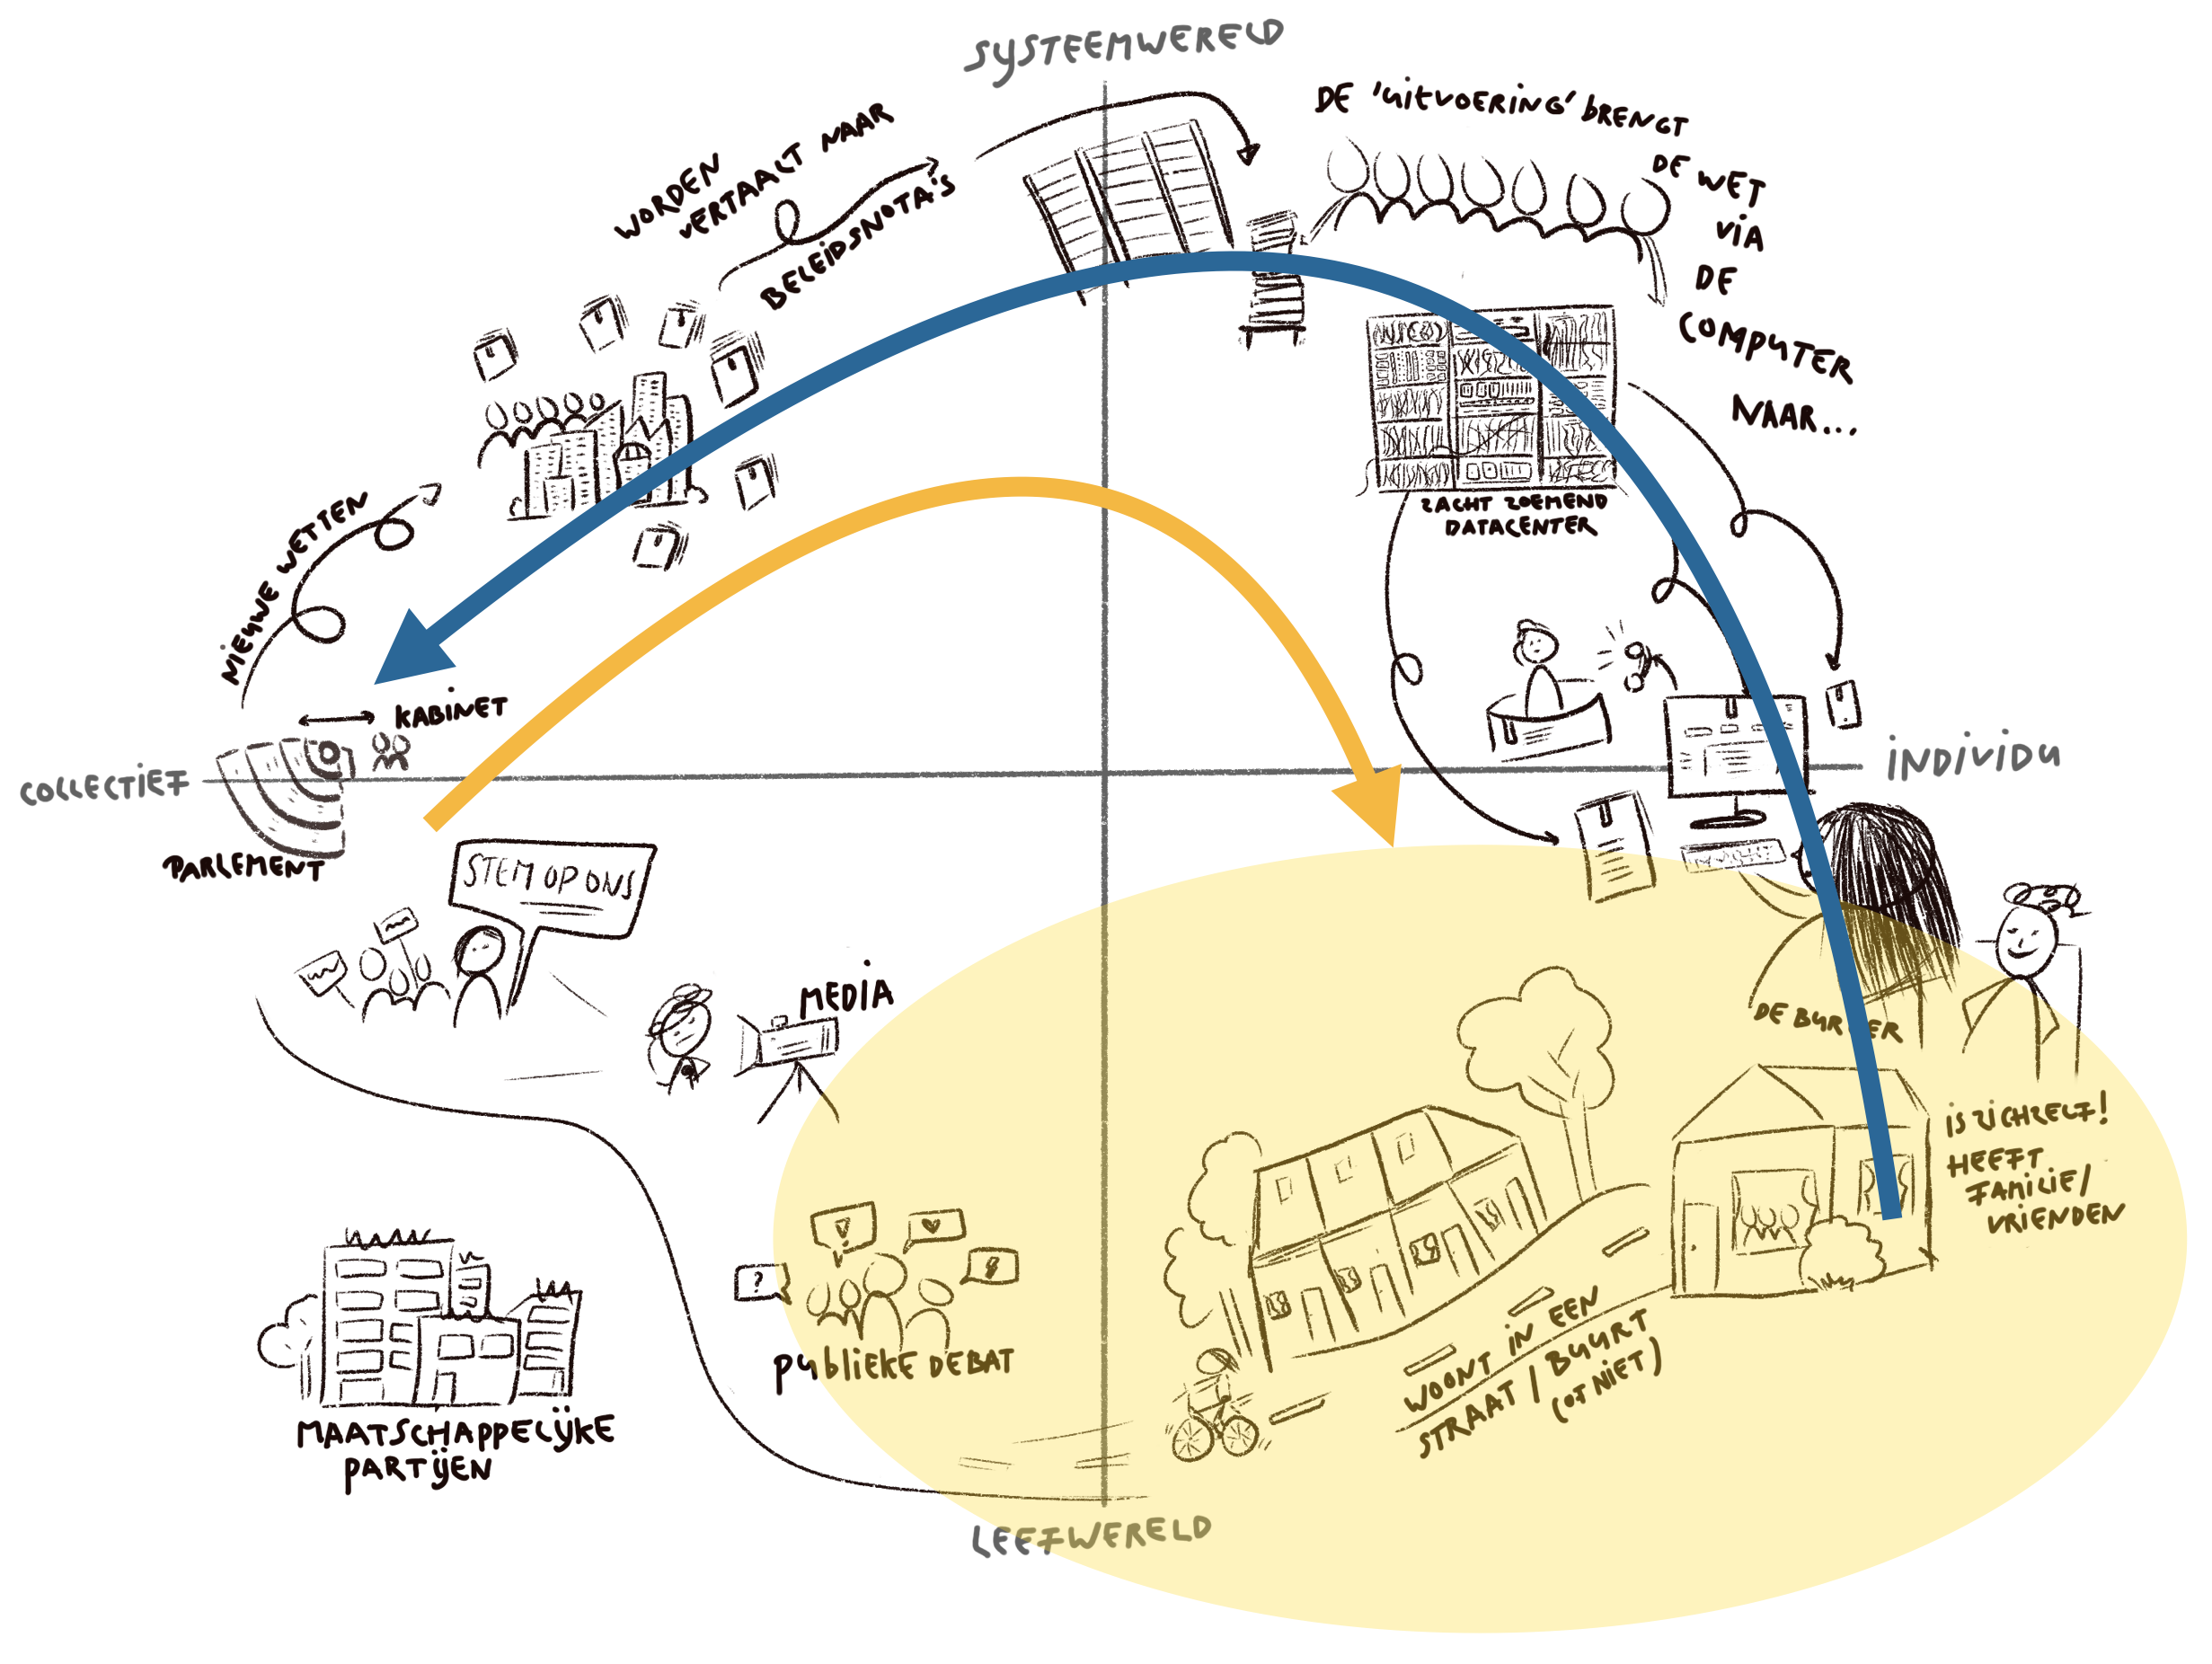
One of the biggest challenges facing government organizations today is to operate and organize from the citizens’ perspective—and to combine this with democratic processes, deeply ingrained organizational practices, and automation. Science often doesn’t have an answer to this (yet). So it’s really cool for both sides when a researcher is allowed to delve so deeply into an organization and publish scientific findings about it.
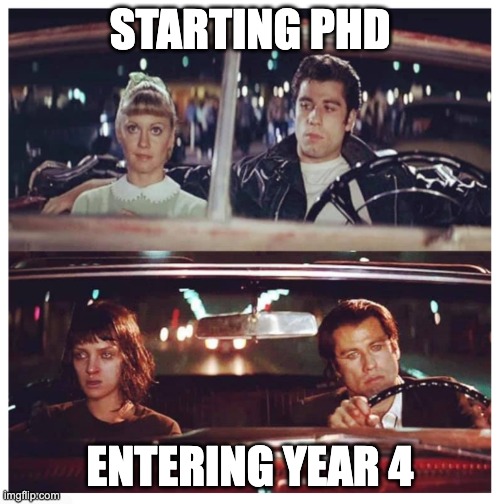
But it’s not your typical PhD research
And it’s not just an ordinary job in practice, either.
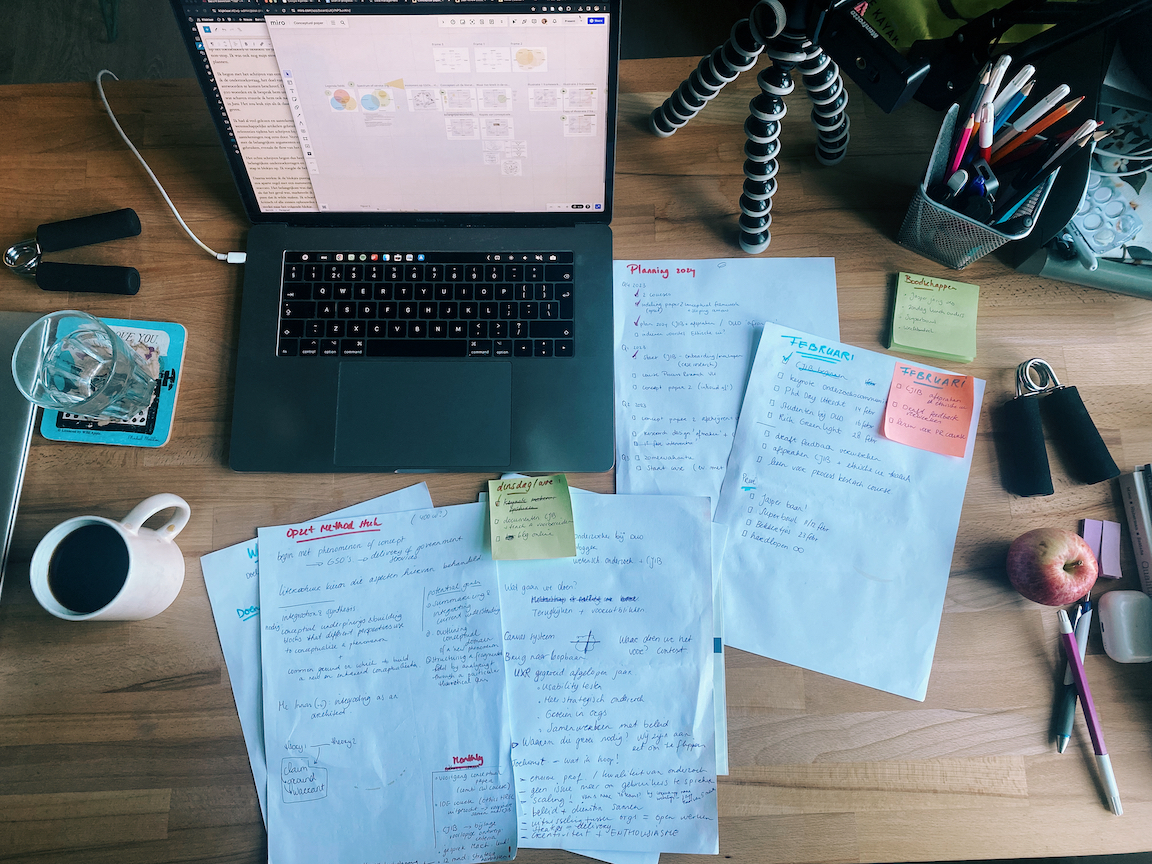
I find that the hardest part of this combination is balancing my work in the field as an action researcher with my role as a scholar. When I started, I thought I’d be fully immersed in fieldwork and then write about it on Fridays. In reality, it’s the other way around. I spend at least three-quarters of my time reading, writing, analyzing data, taking courses, and drafting my articles. These are all things I don’t need to be physically present at the organization to do. In fact, being there often just distracts me from them.
I often feel guilty toward the team because I should be there more often and help out more—“after all, it is action research”—and there’s so much going on that I feel I could contribute to. At the same time, my role on the team is to conduct scientific research, and I need to have a dissertation ready in a year.
So you’re constantly choosing between acting now and taking a step back to invest in your dissertation for the long term.
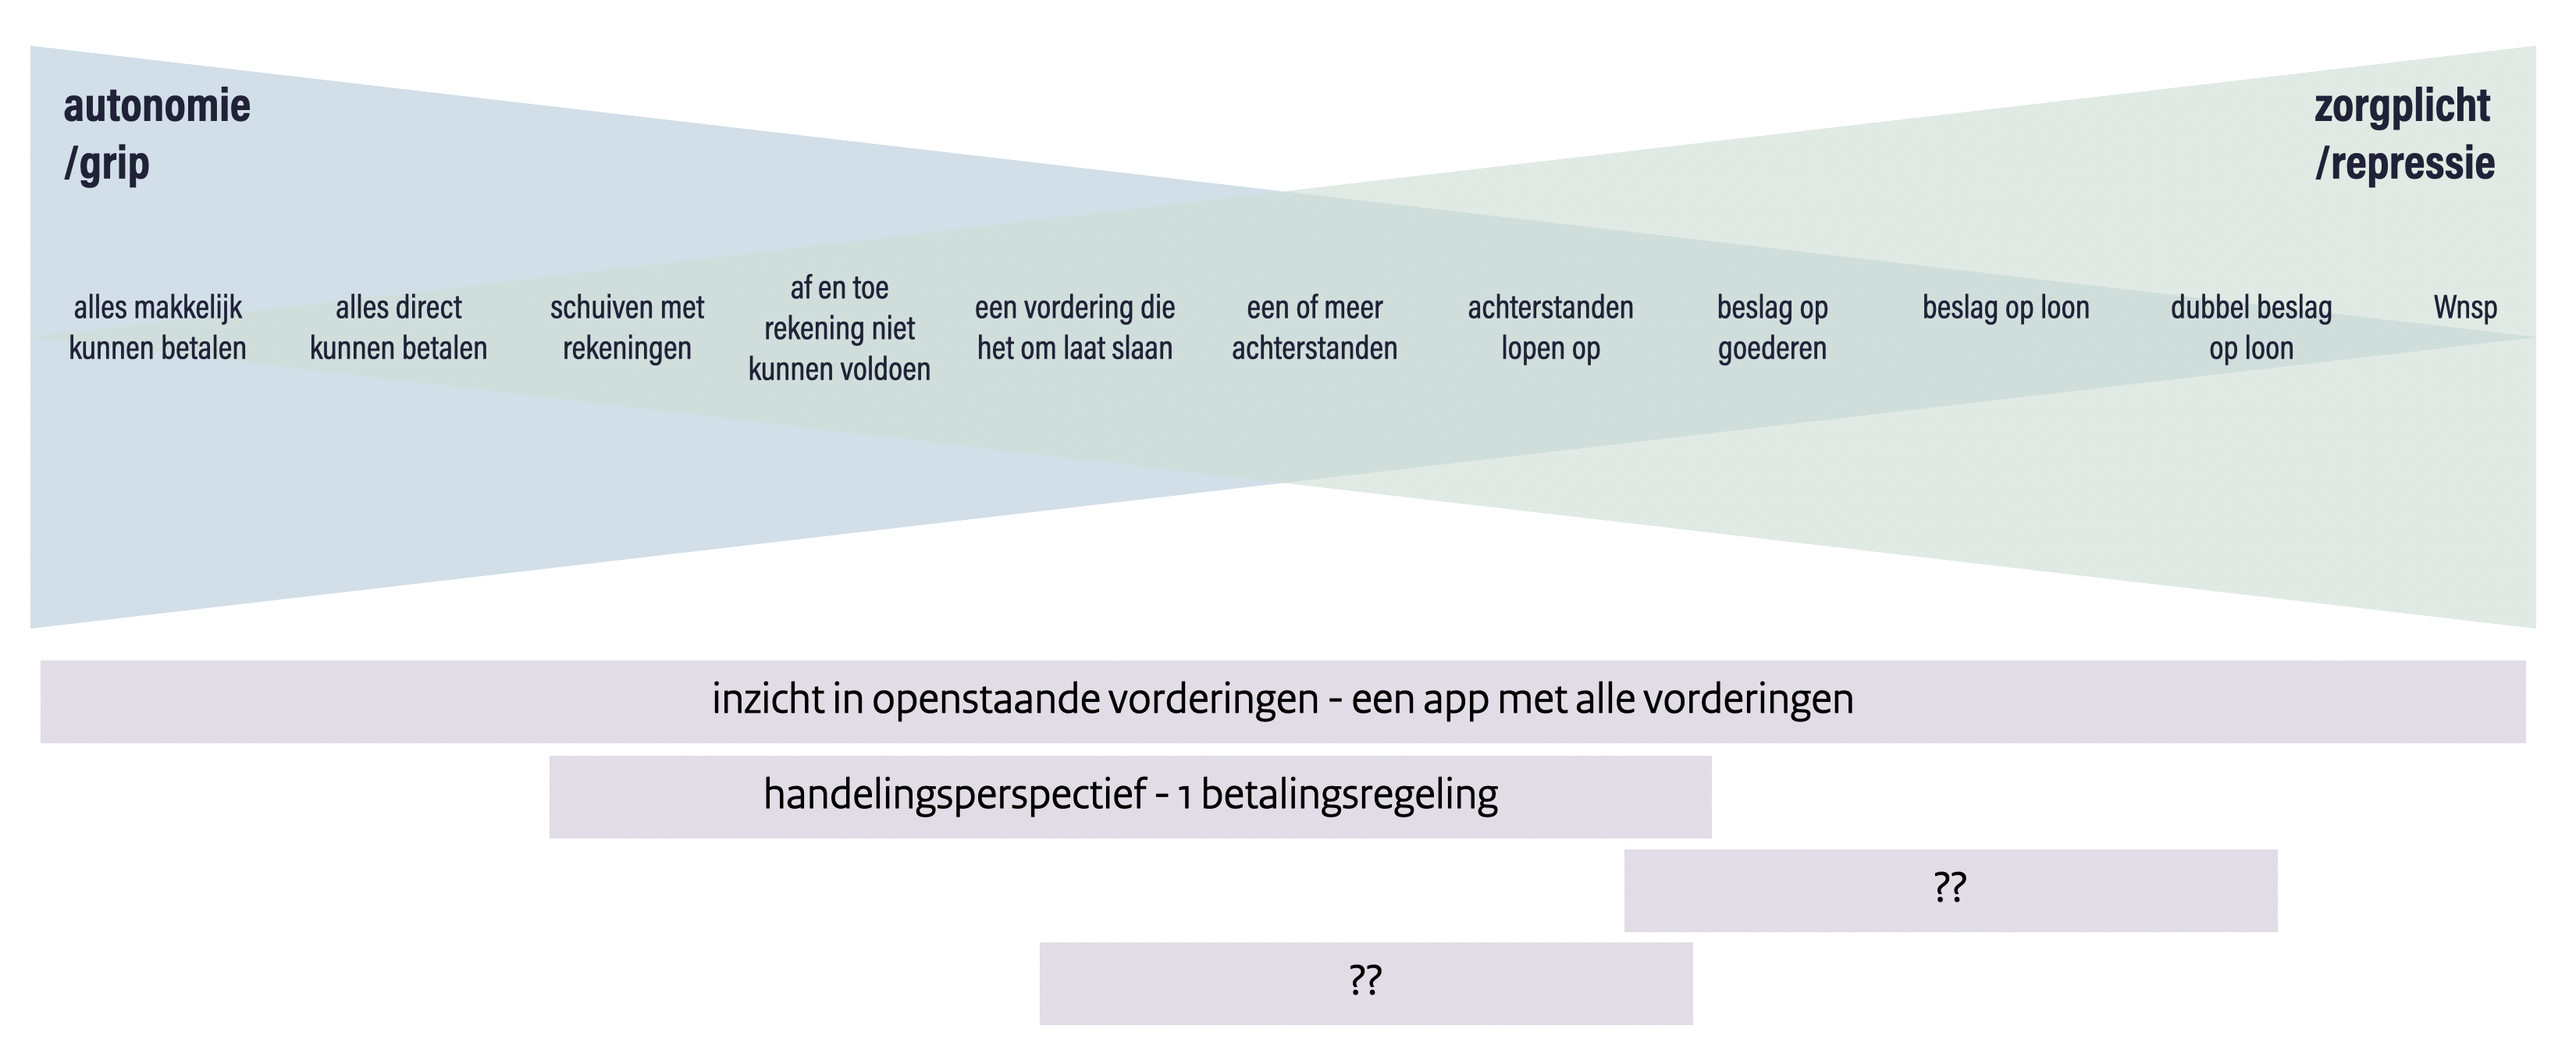
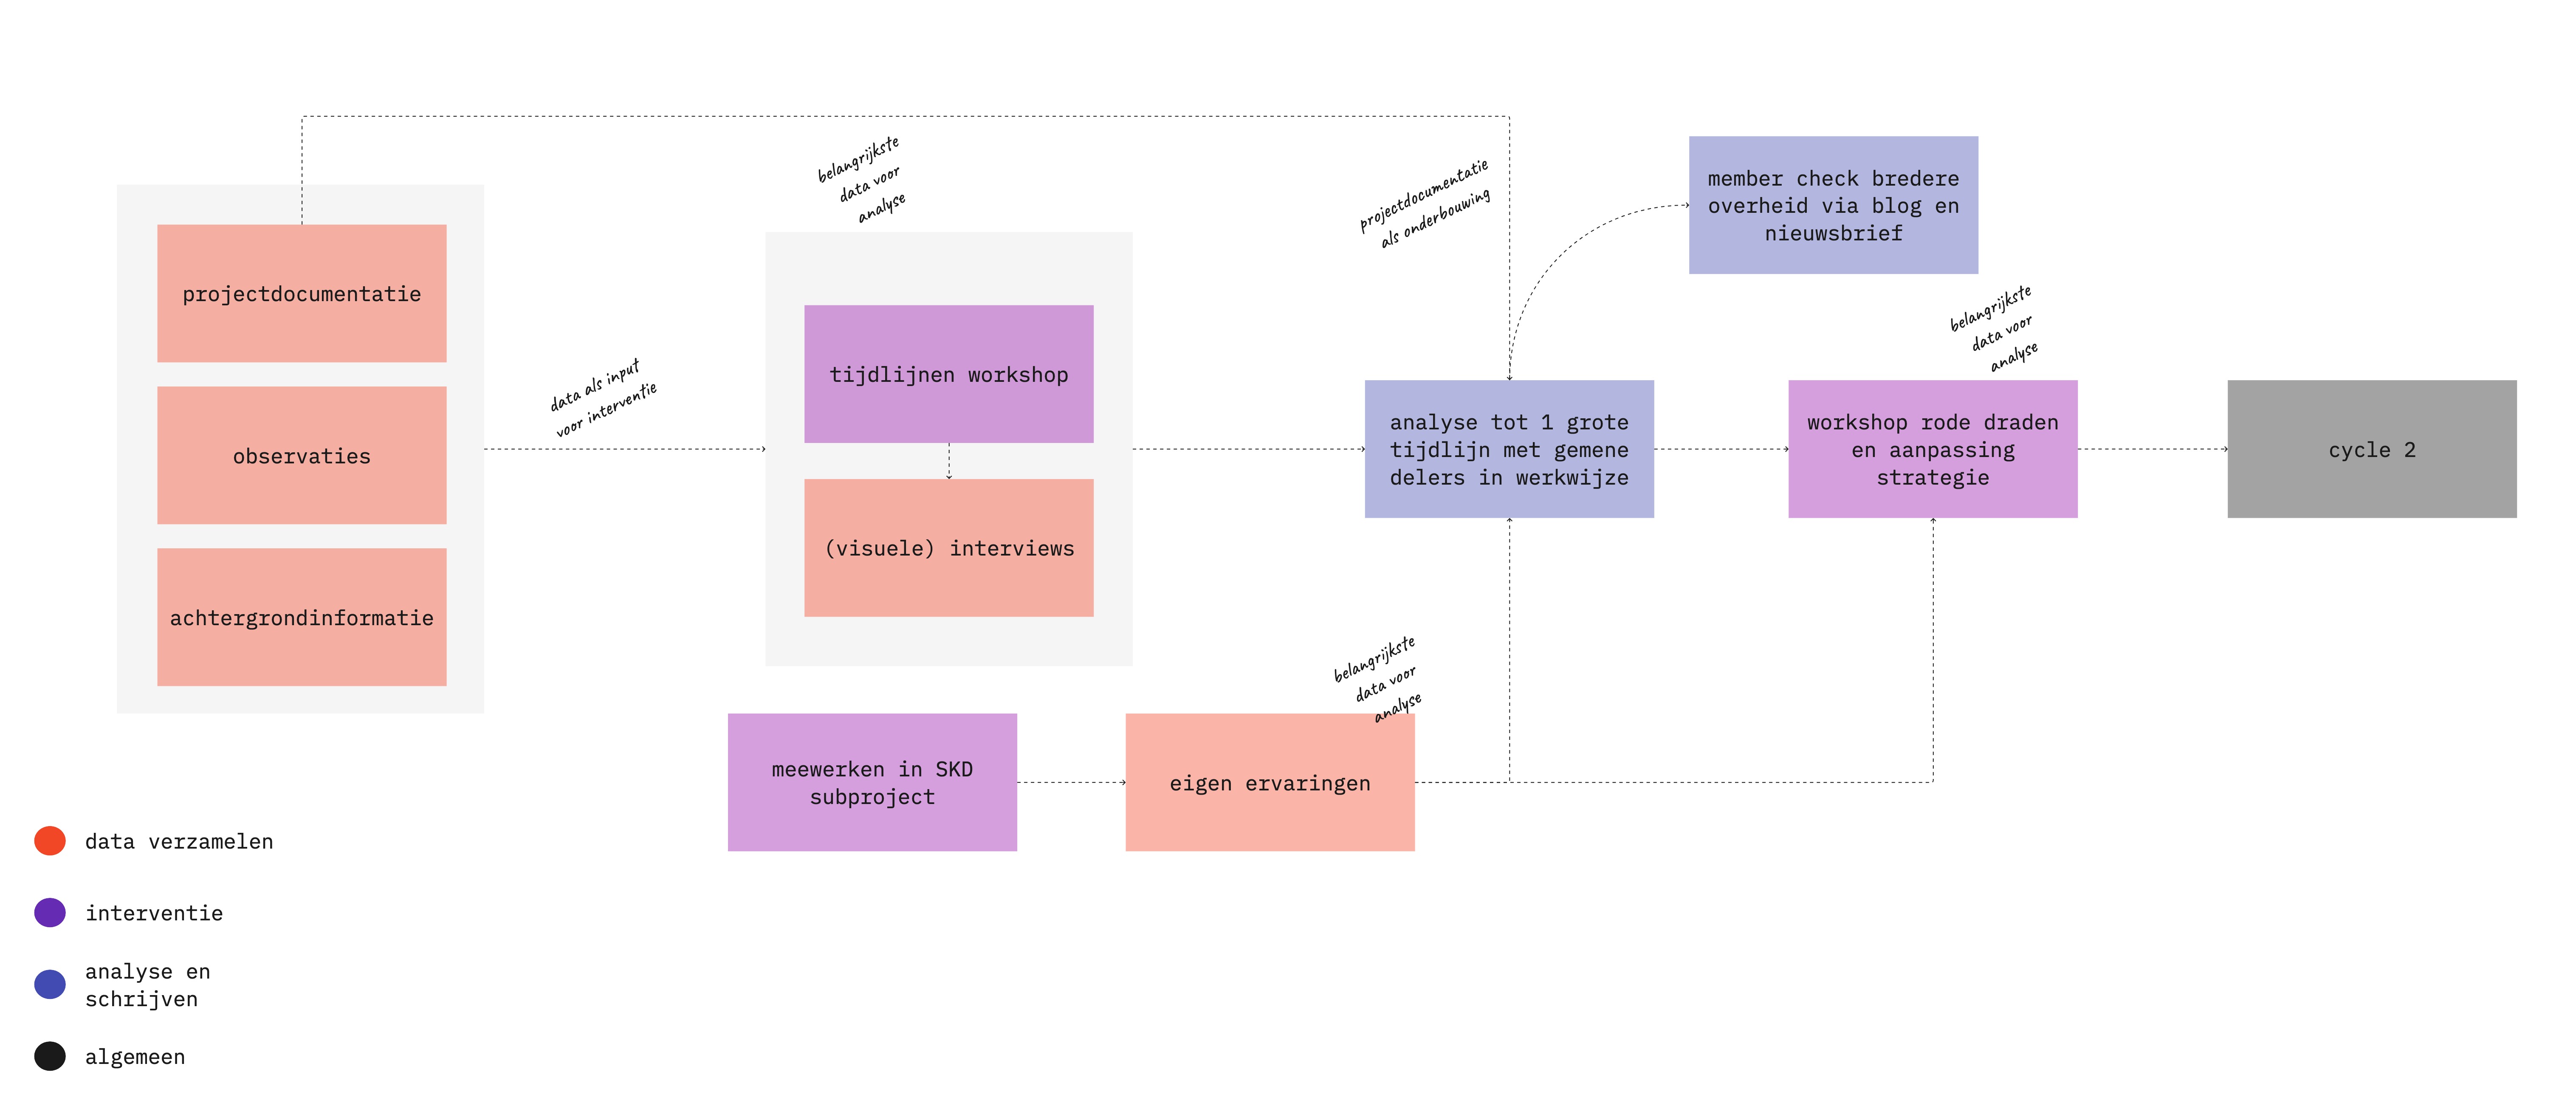
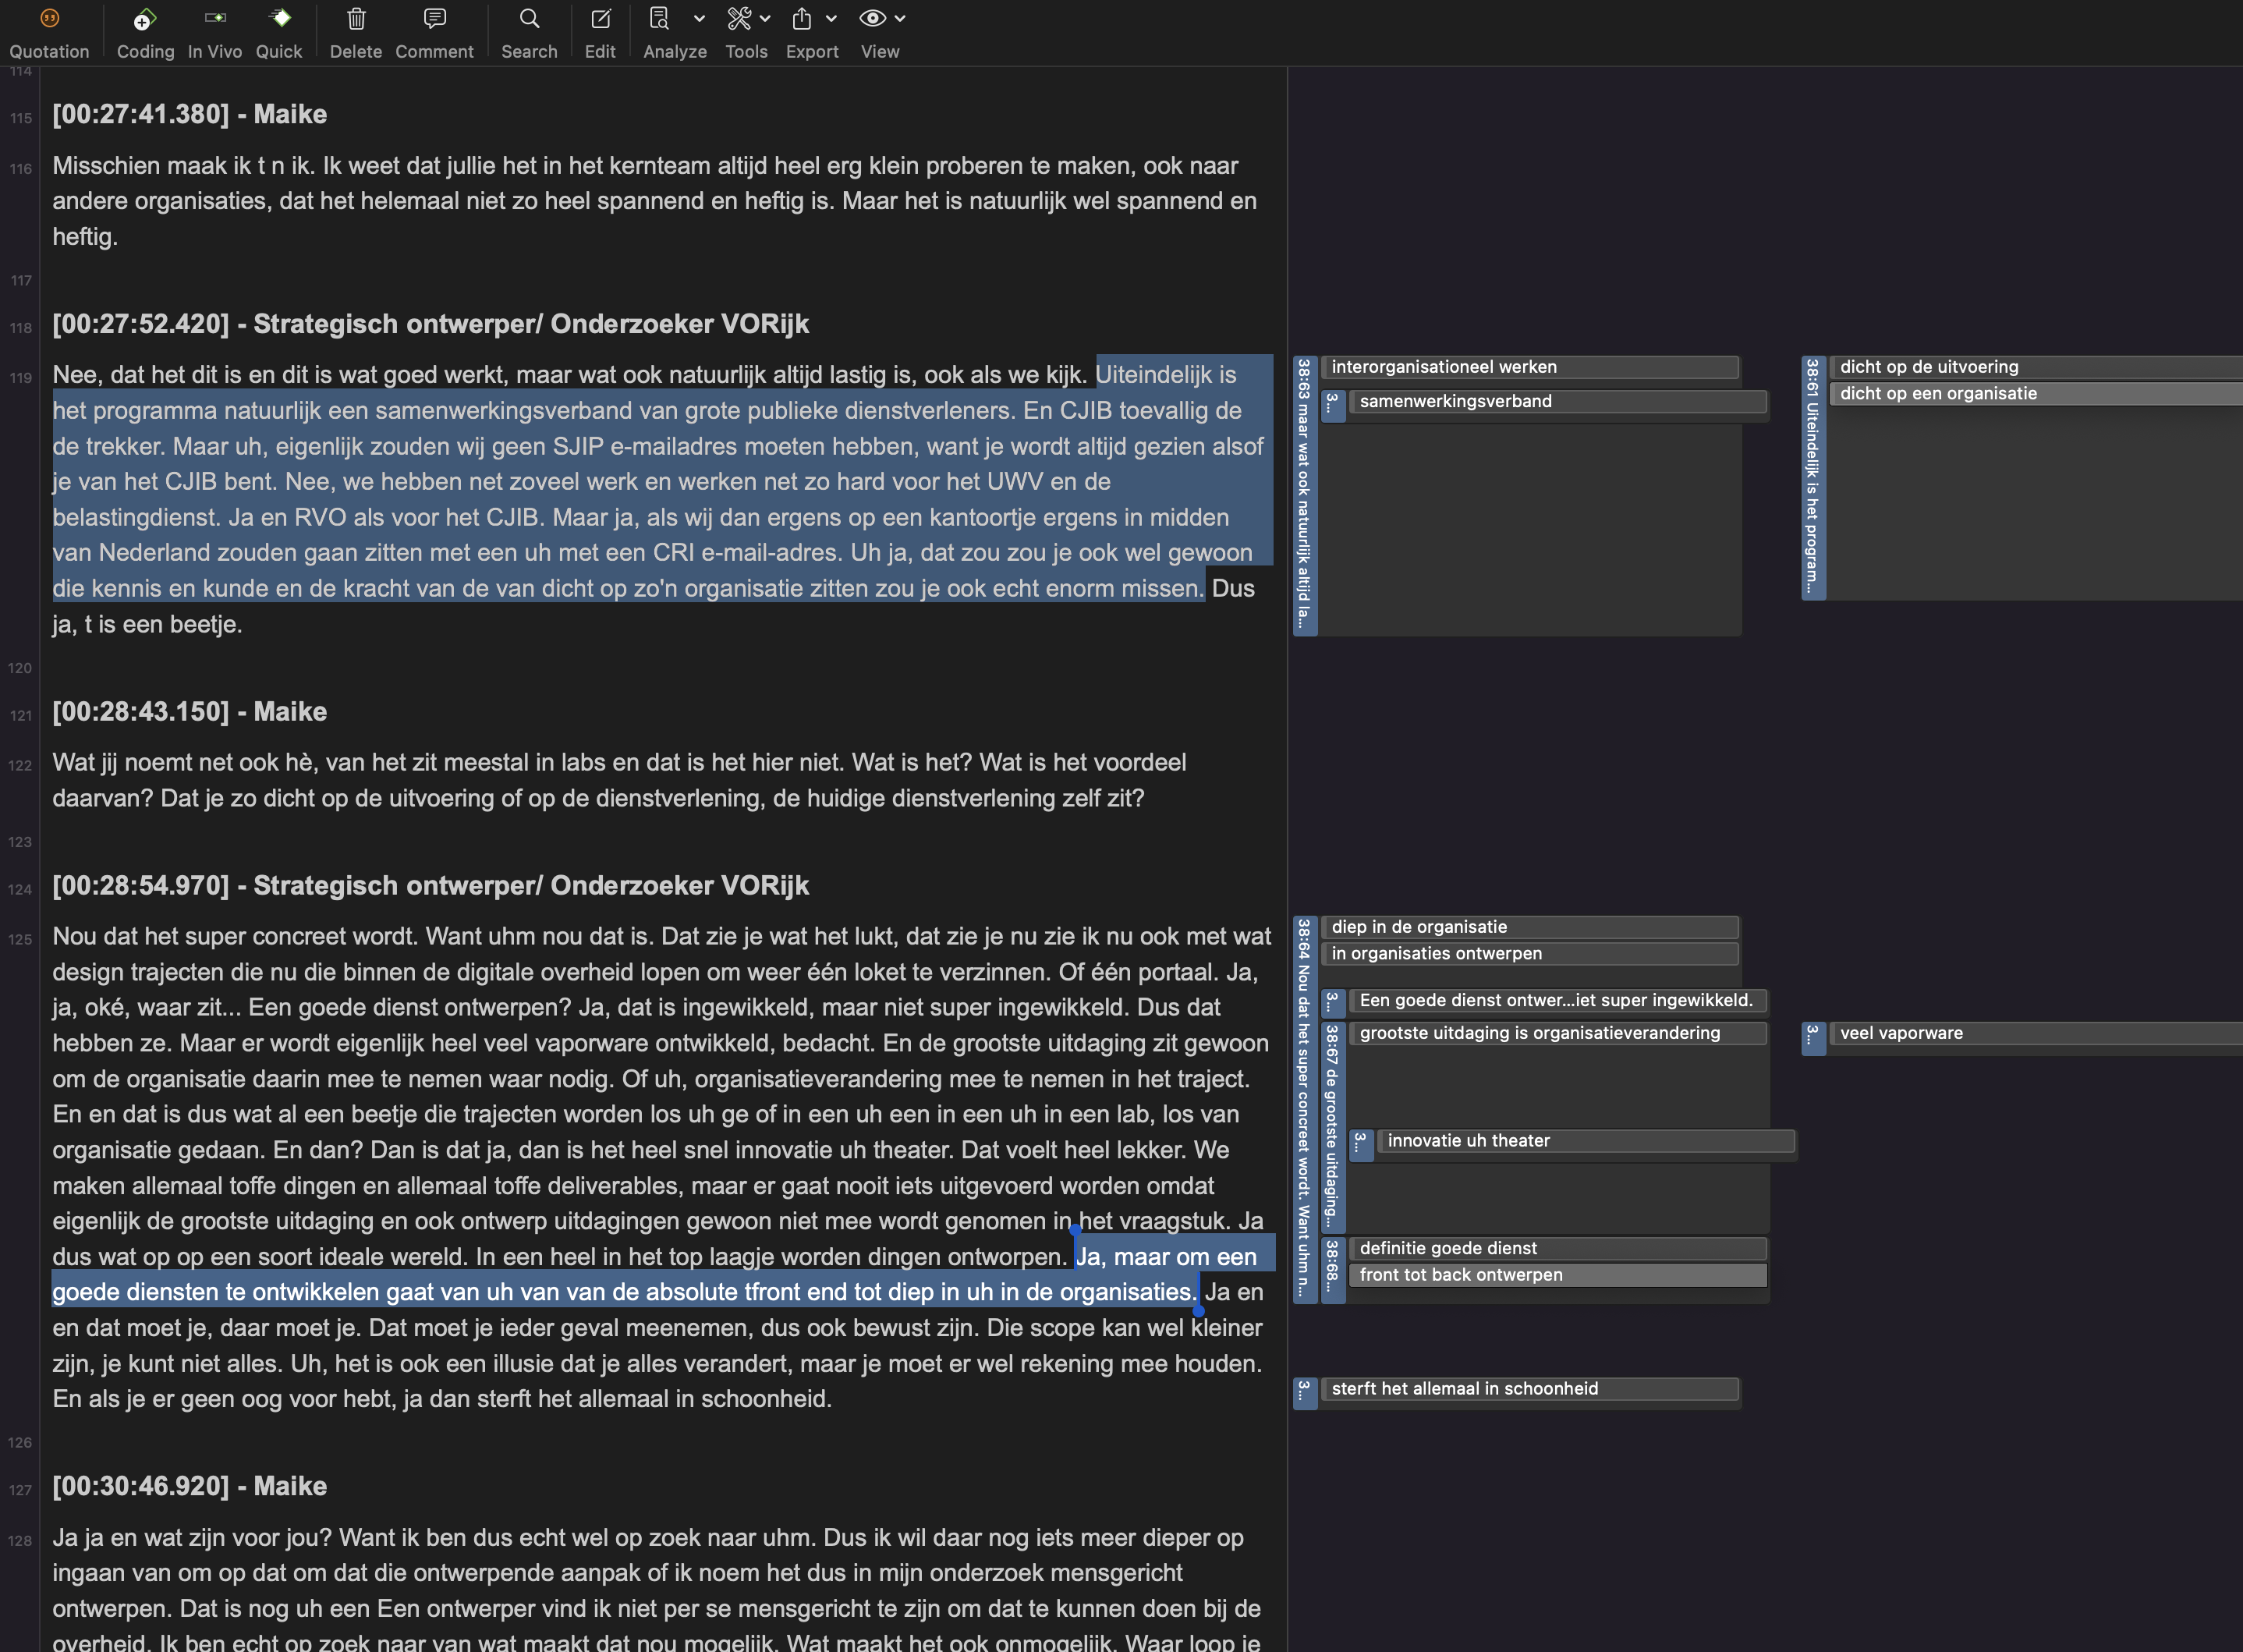
By now, I could probably fill three dissertations with what I see and hear at Clustering Rijksincasso, my case study, but even one is complicated enough. The real value lies not in piling up more and more observations and interventions, but in analyzing, interpreting, and publishing patterns and decisions. So it’s not just about the action, but also—and especially—about the research, and both you and the organization have to get used to that.
They’re also supposed to protect you a little (and you should protect yourself, too)
I have a wonderful manager at DUO (the organization that is my sponsor for the entire four years) who regularly asks how I’m doing —not just about my doctoral research. At the CJIB (where I’m doing research on secondment for two years), I have a supervisor who gives me complete freedom to organize my work myself, in terms of both time and content. At TU Delft, I have two advisors who keep a close eye on me to ensure I fulfill my academic responsibilities and don’t take on too many practical tasks. And at home, I have a wonderful husband who, at some point, asks if I’m coming to dinner, and after dinner, I make sure not to work anymore.
A practice-based Ph.D. sounds dynamic and free, but without clear boundaries, you run the risk of getting overwhelmed by academic ambition, practical data, and the conflicting interests of the organizations involved. It is therefore essential to establish clear agreements from the outset: regarding your role, your academic freedom, and confidentiality (and especially: the waiver of that confidentiality as a civil servant, so that you can actually publish your work).
Such an explicit demarcation is not a bureaucratic detail, but a prerequisite for a doctoral candidate to survive.
Start a journal
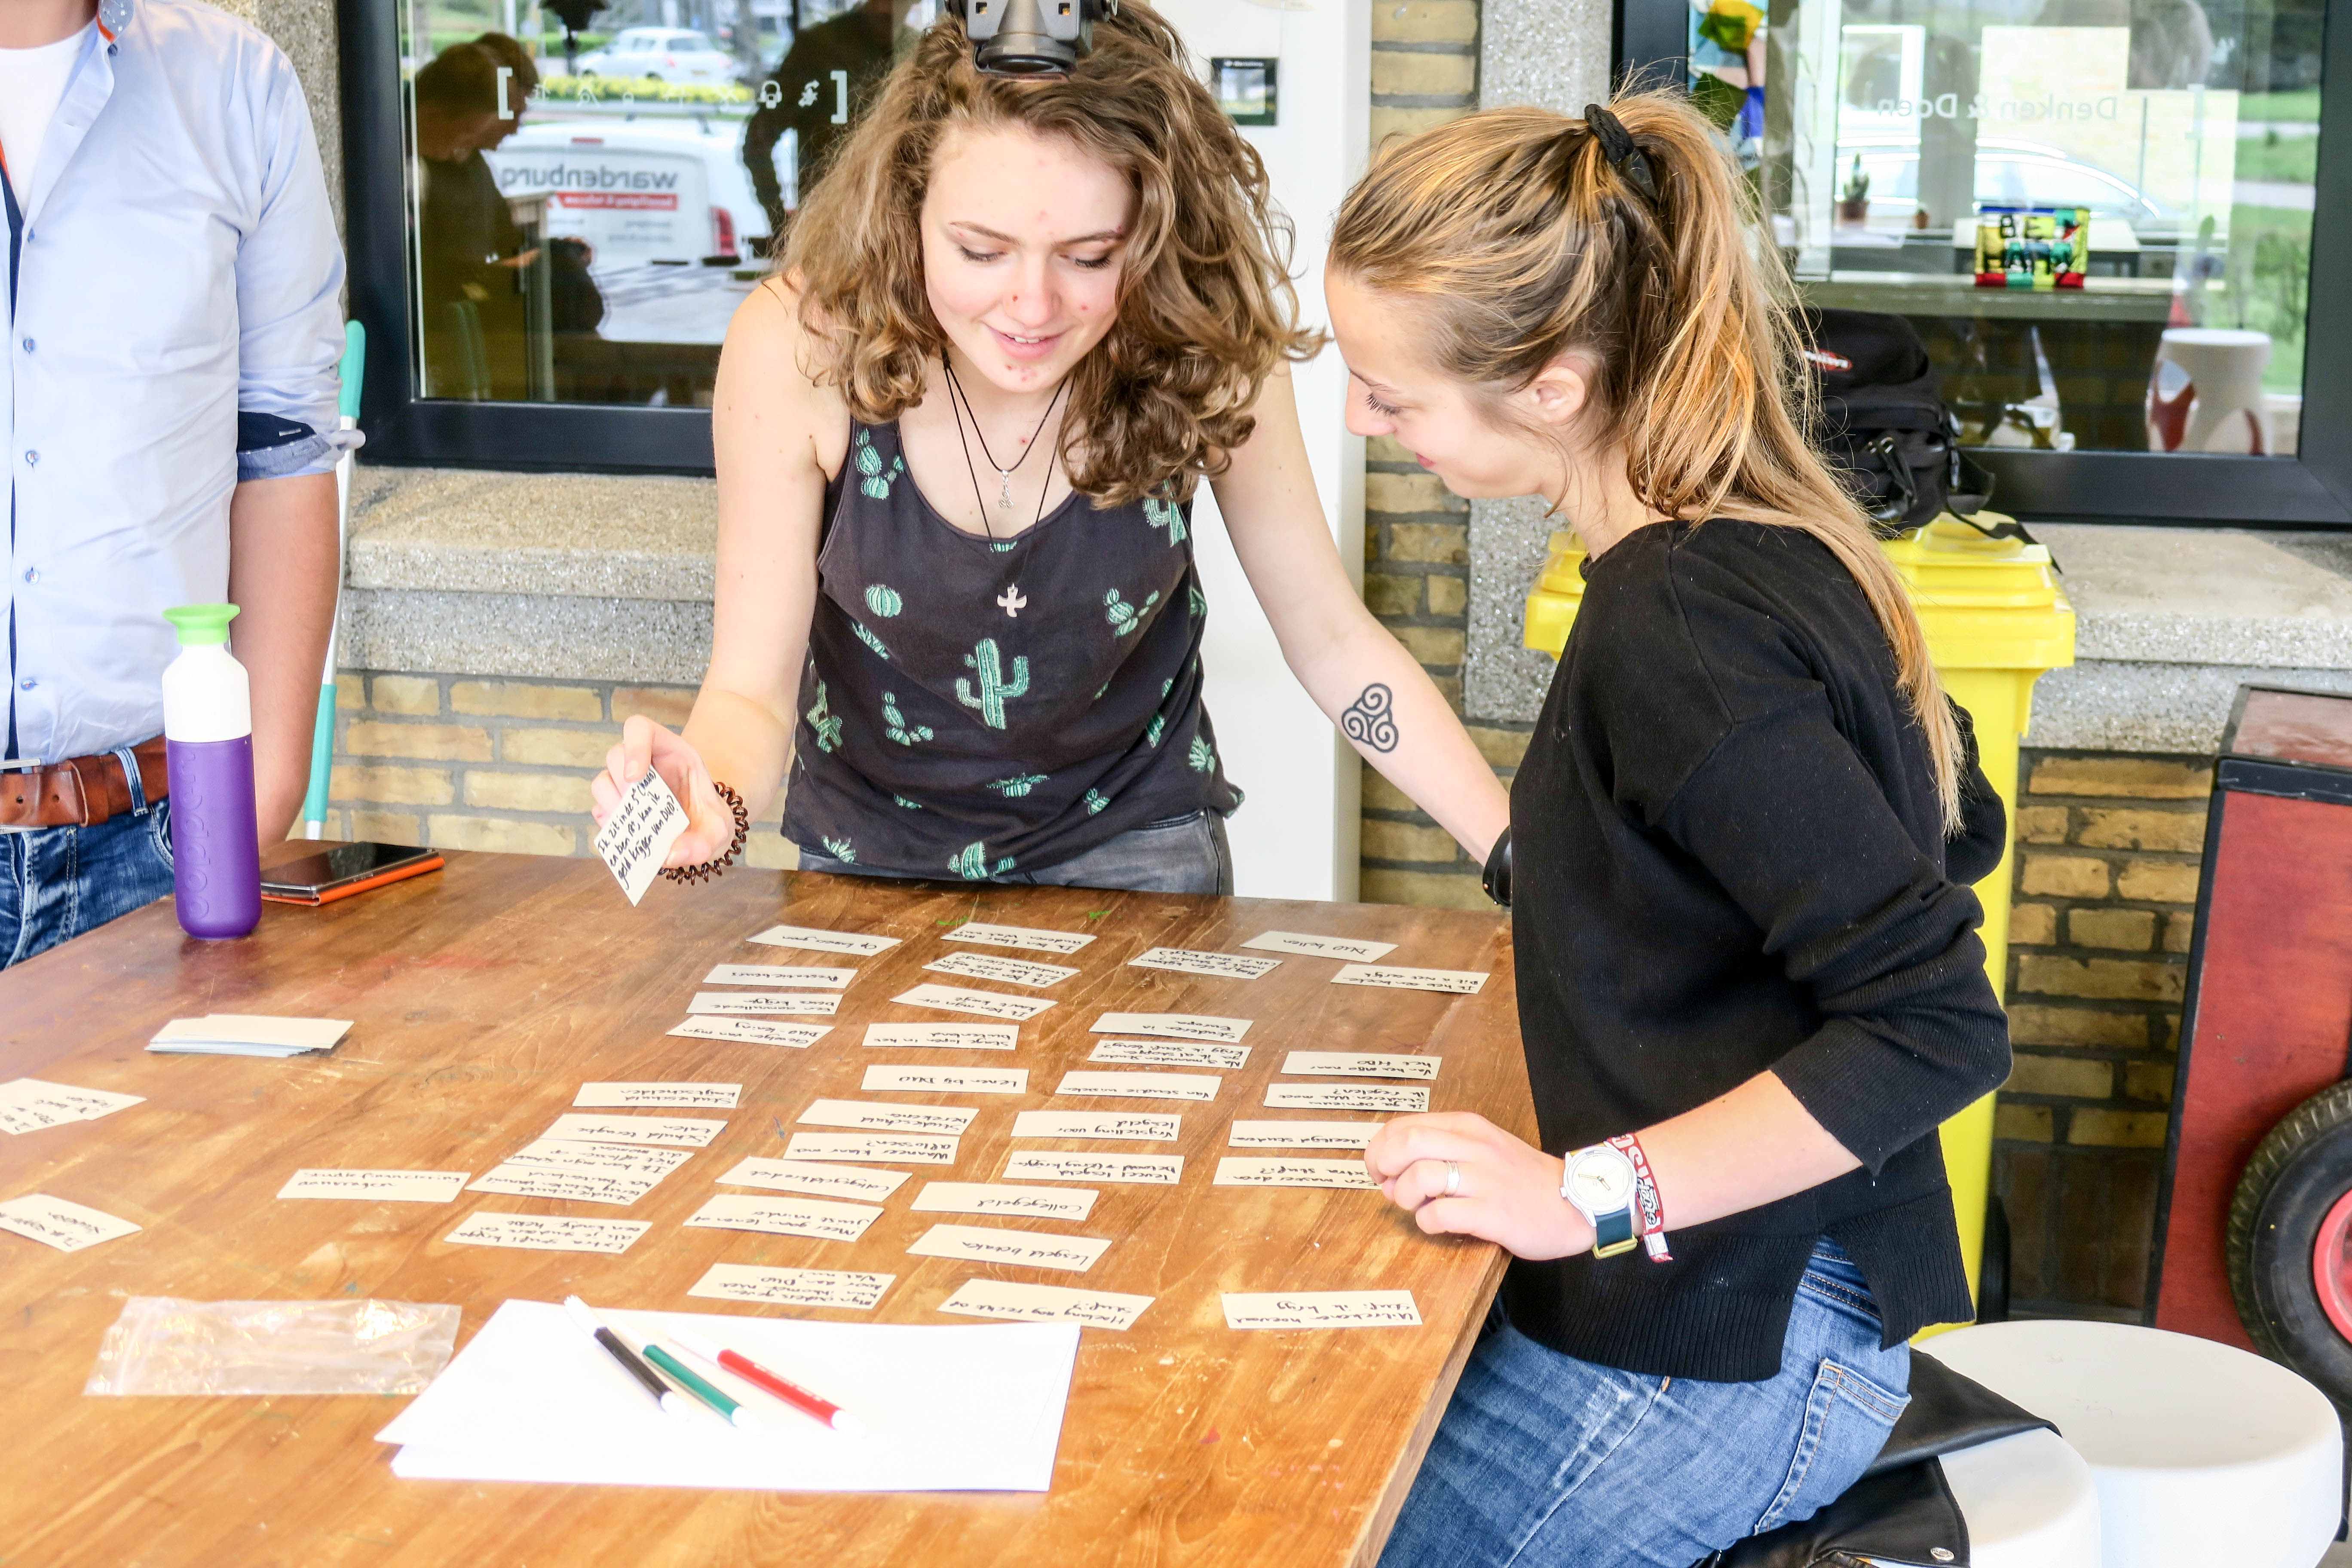
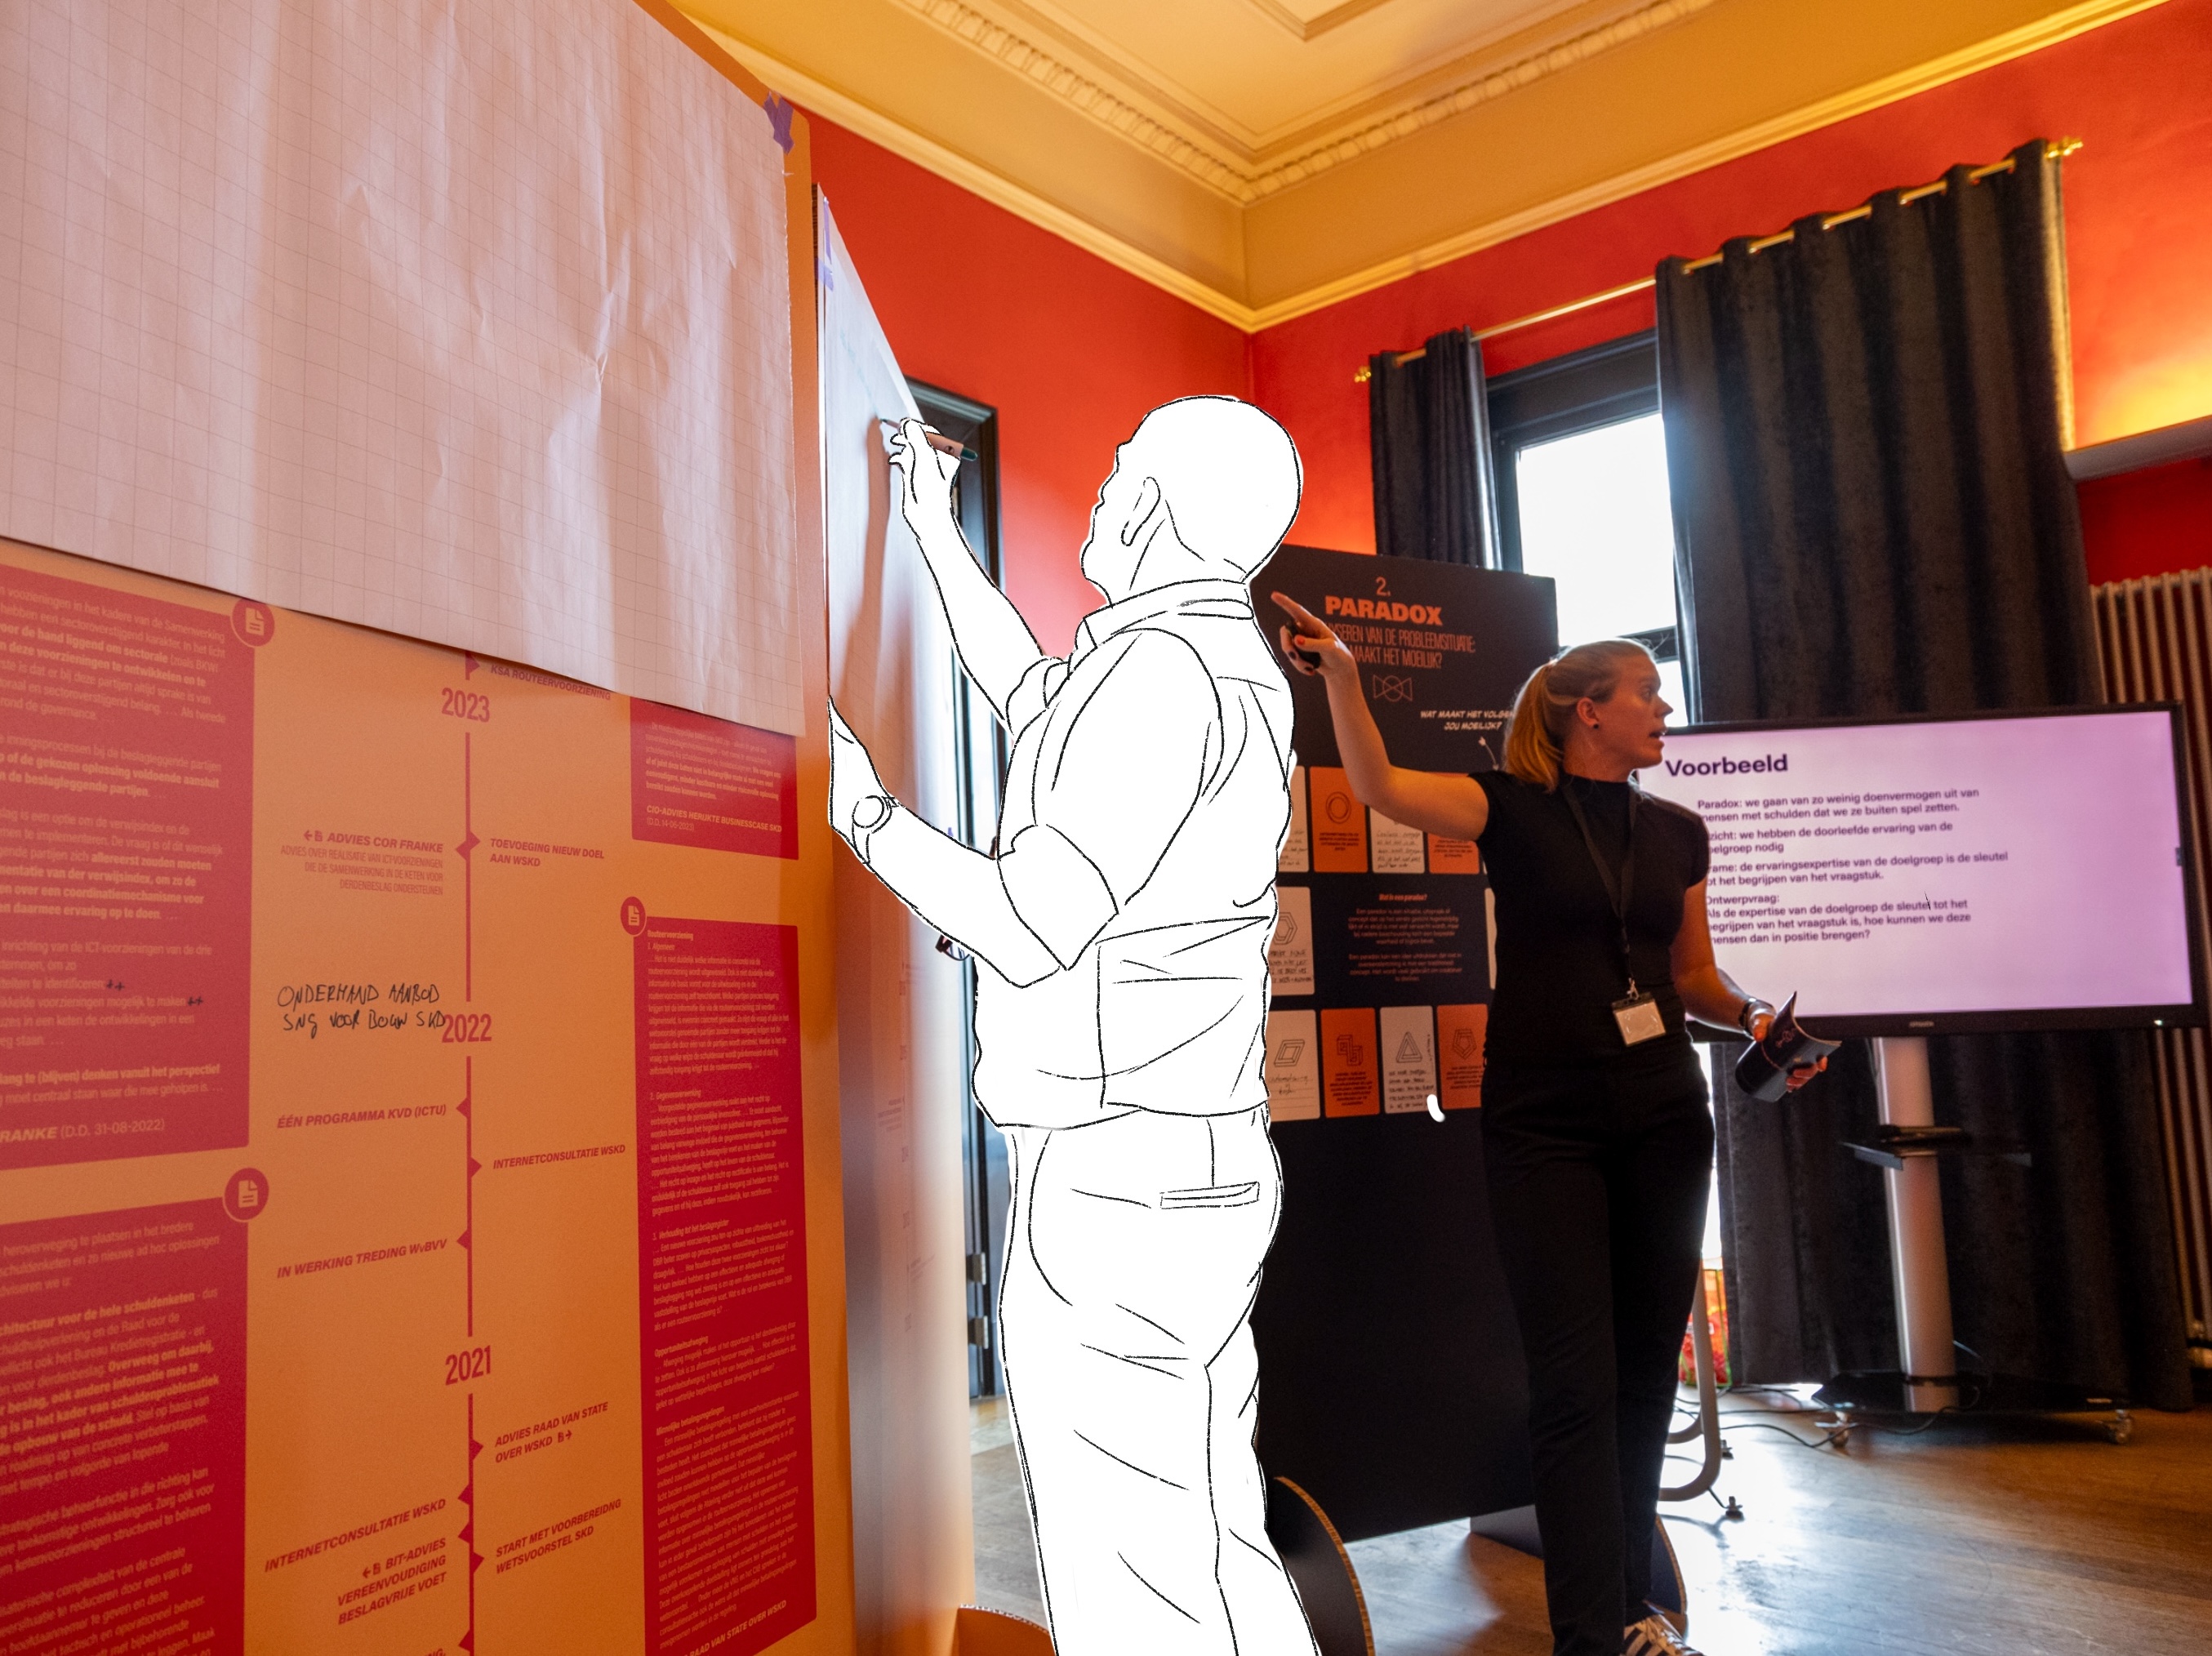
In practice, you’re never just a researcher. Sometimes you’re in a meeting as a consultant, sometimes in a workshop as a designer, and sometimes just hanging out with colleagues at the coffee machine. Those roles are valuable, but also tricky: before you know it, you’re seen primarily as a consultant, and your academic side fades into the background. Remember that no matter what role you’re in, you’re always a researcher, too.
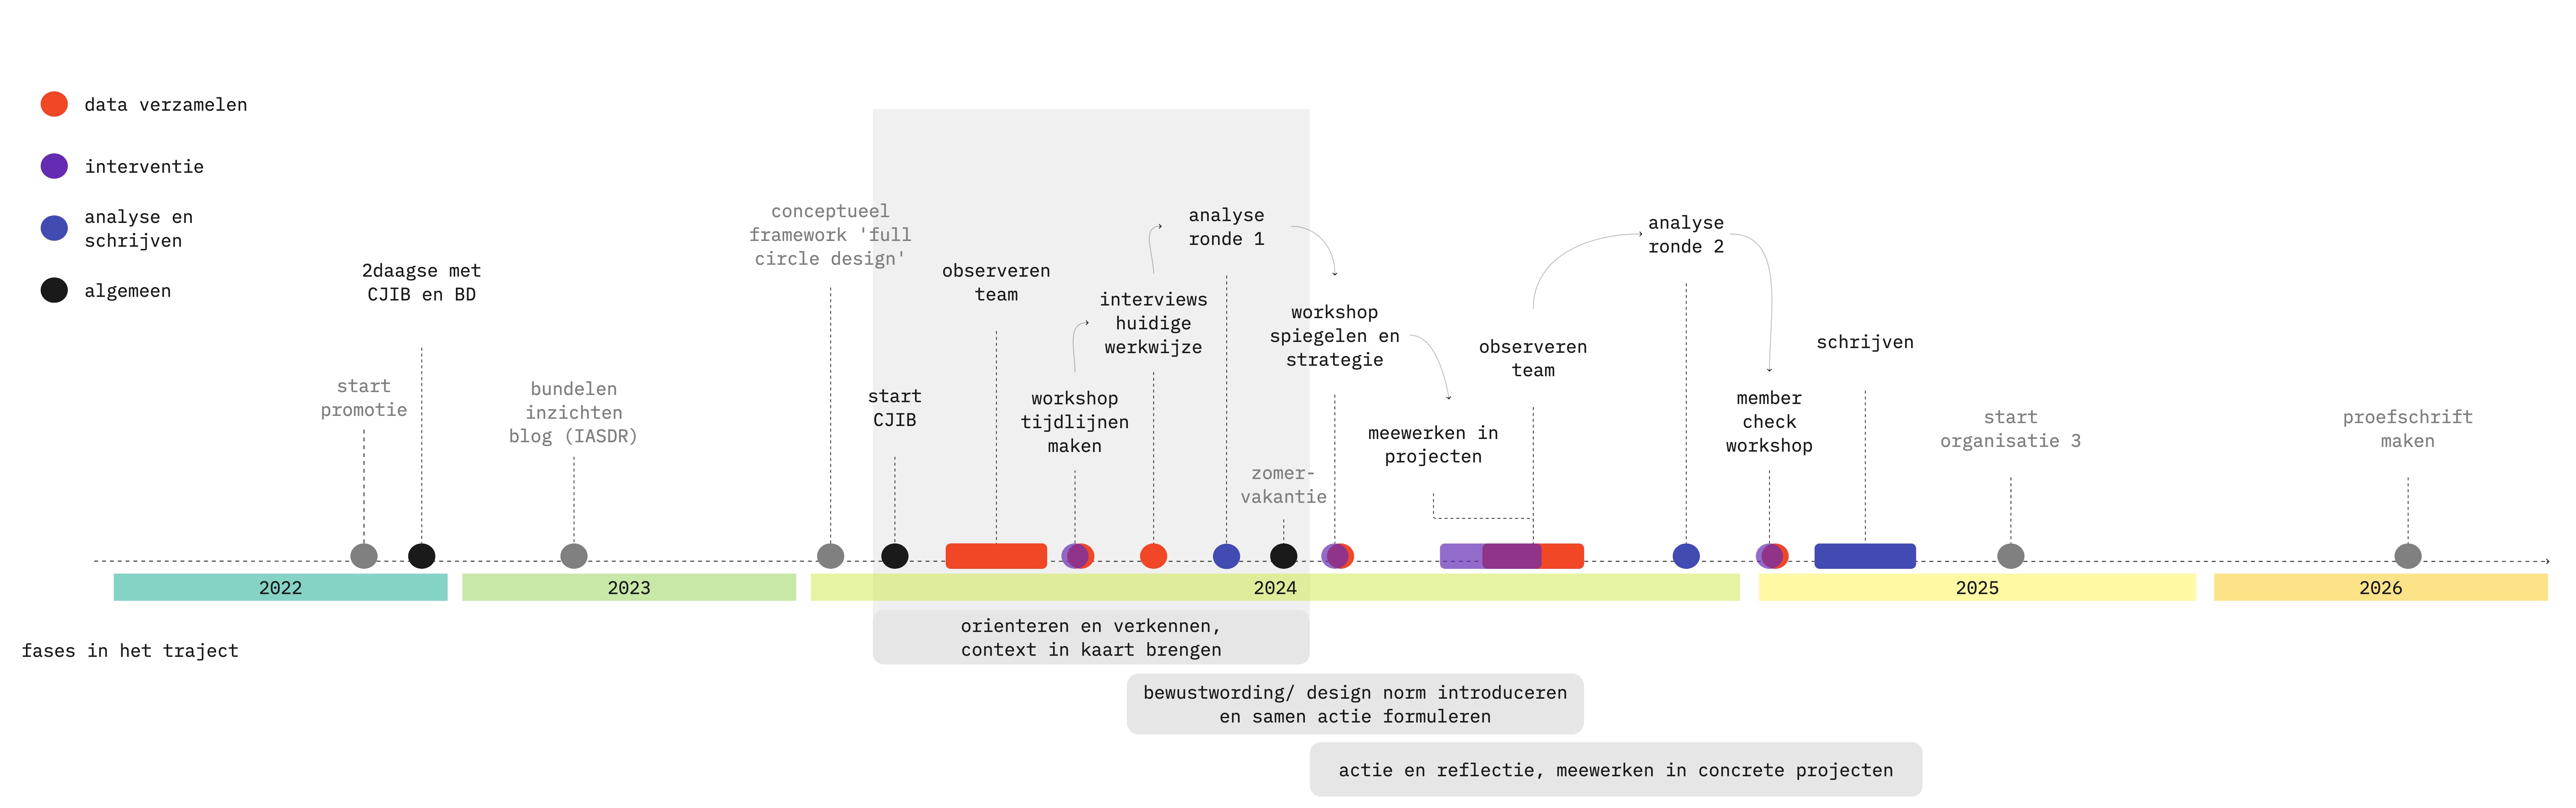
So start keeping a journal from day one. Write down what happens, and keep your calendar up to date so you can easily look up specific moments in time. Everything that happens is ✨data✨, and you’ll be glad later on if you record it properly. Don’t write long passages; keep it short and to the point. Record conversations—just be sure to ask for permission first. This goes especially for group conversations—they’re often very interesting.
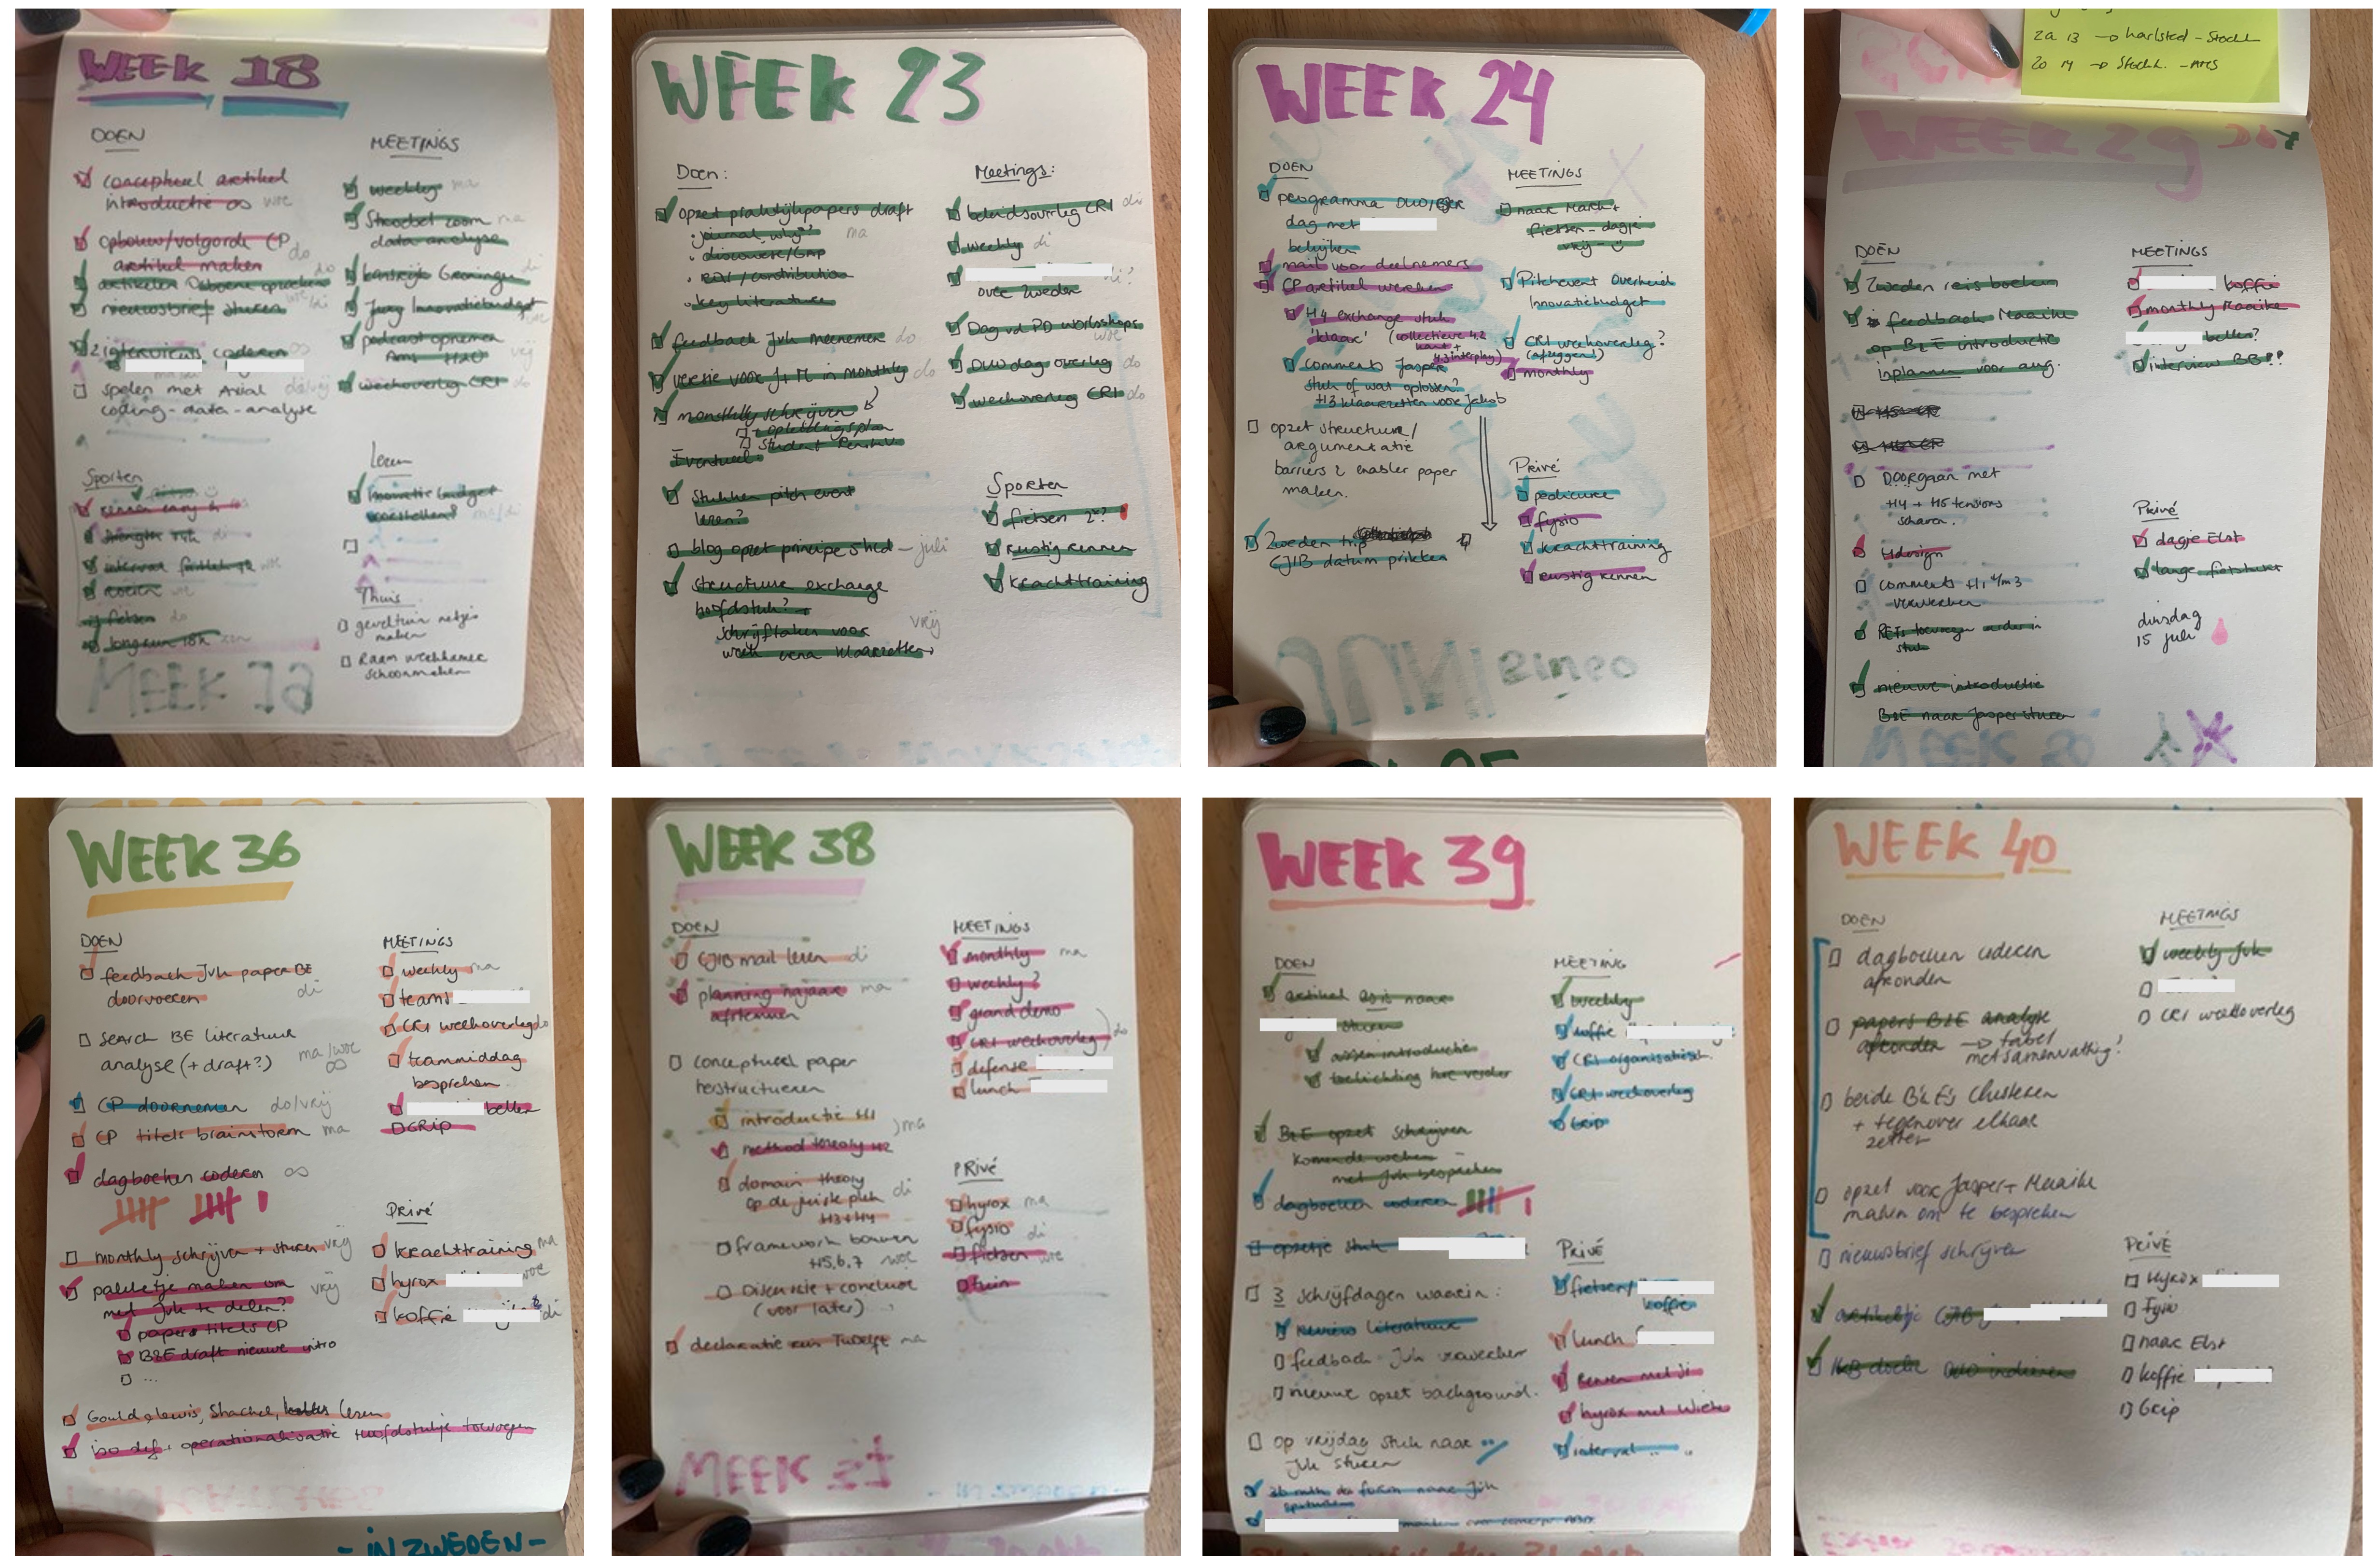
And make sure you can easily find everything right from the start. Otherwise, you’ll soon lose track of what caused what, and what your own influence was, and it’ll all turn into a big mess. It’s bound to happen anyway, and then your calendar and journal will be the guide that leads you blindly back into that data swamp.
More tips for Ph.D. students
Get to know your advisors beforehand. You’ll be working with them for four years, and they’re responsible, along with you, for the success of the project. You’ll want to know in advance whether you click with them. Read some of their work and see if you find what they do and how they work interesting.
If possible, keep your steering group small. The more people and organizations there are, the more interests you’ll have to manage. And you’re the one who has to go back and forth between them, coordinating on working methods and draft articles. Make clear agreements and don’t let it drive you crazy. Take the lead.
Learn to say no. Say no to more data, to contributing ideas to a project, to working at the office when you’d rather be at school or have a quieter desk at home, to lunch meetings (except with friends), to your advisors if other opportunities come up. And say no to yourself if you want more, but remember that less is also enough for a fantastic dissertation.
Don’t tell too many people that you’re going to do this. And definitely don’t start a newsletter or blog where you have to think every month about what to tell your readers, while you’re making zero progress, have no idea how to move forward, and are considering opening a nail salon. Give yourself time to fail and figure out how to move forward. Call your advisors. Or your mom. But above all, don’t start a newsletter.
Tips for Organizations
Don’t view the Ph.D. candidate as a consultant or extra pair of hands, but as a researcher who will truly be of value to you once the dissertation is published. In practice, it’s not quite so black and white—especially in action research, where you learn together through hands-on experience. The Ph.D. candidate brings new insights to the research, and the team can put those insights to use right away. Still, in my experience, it’s very helpful to view the researcher as an added resource, so that the academic goals remain the top priority and aren’t overshadowed. So be sure to give the researcher the space to be away from the field for weeks at a time to process data and write papers.
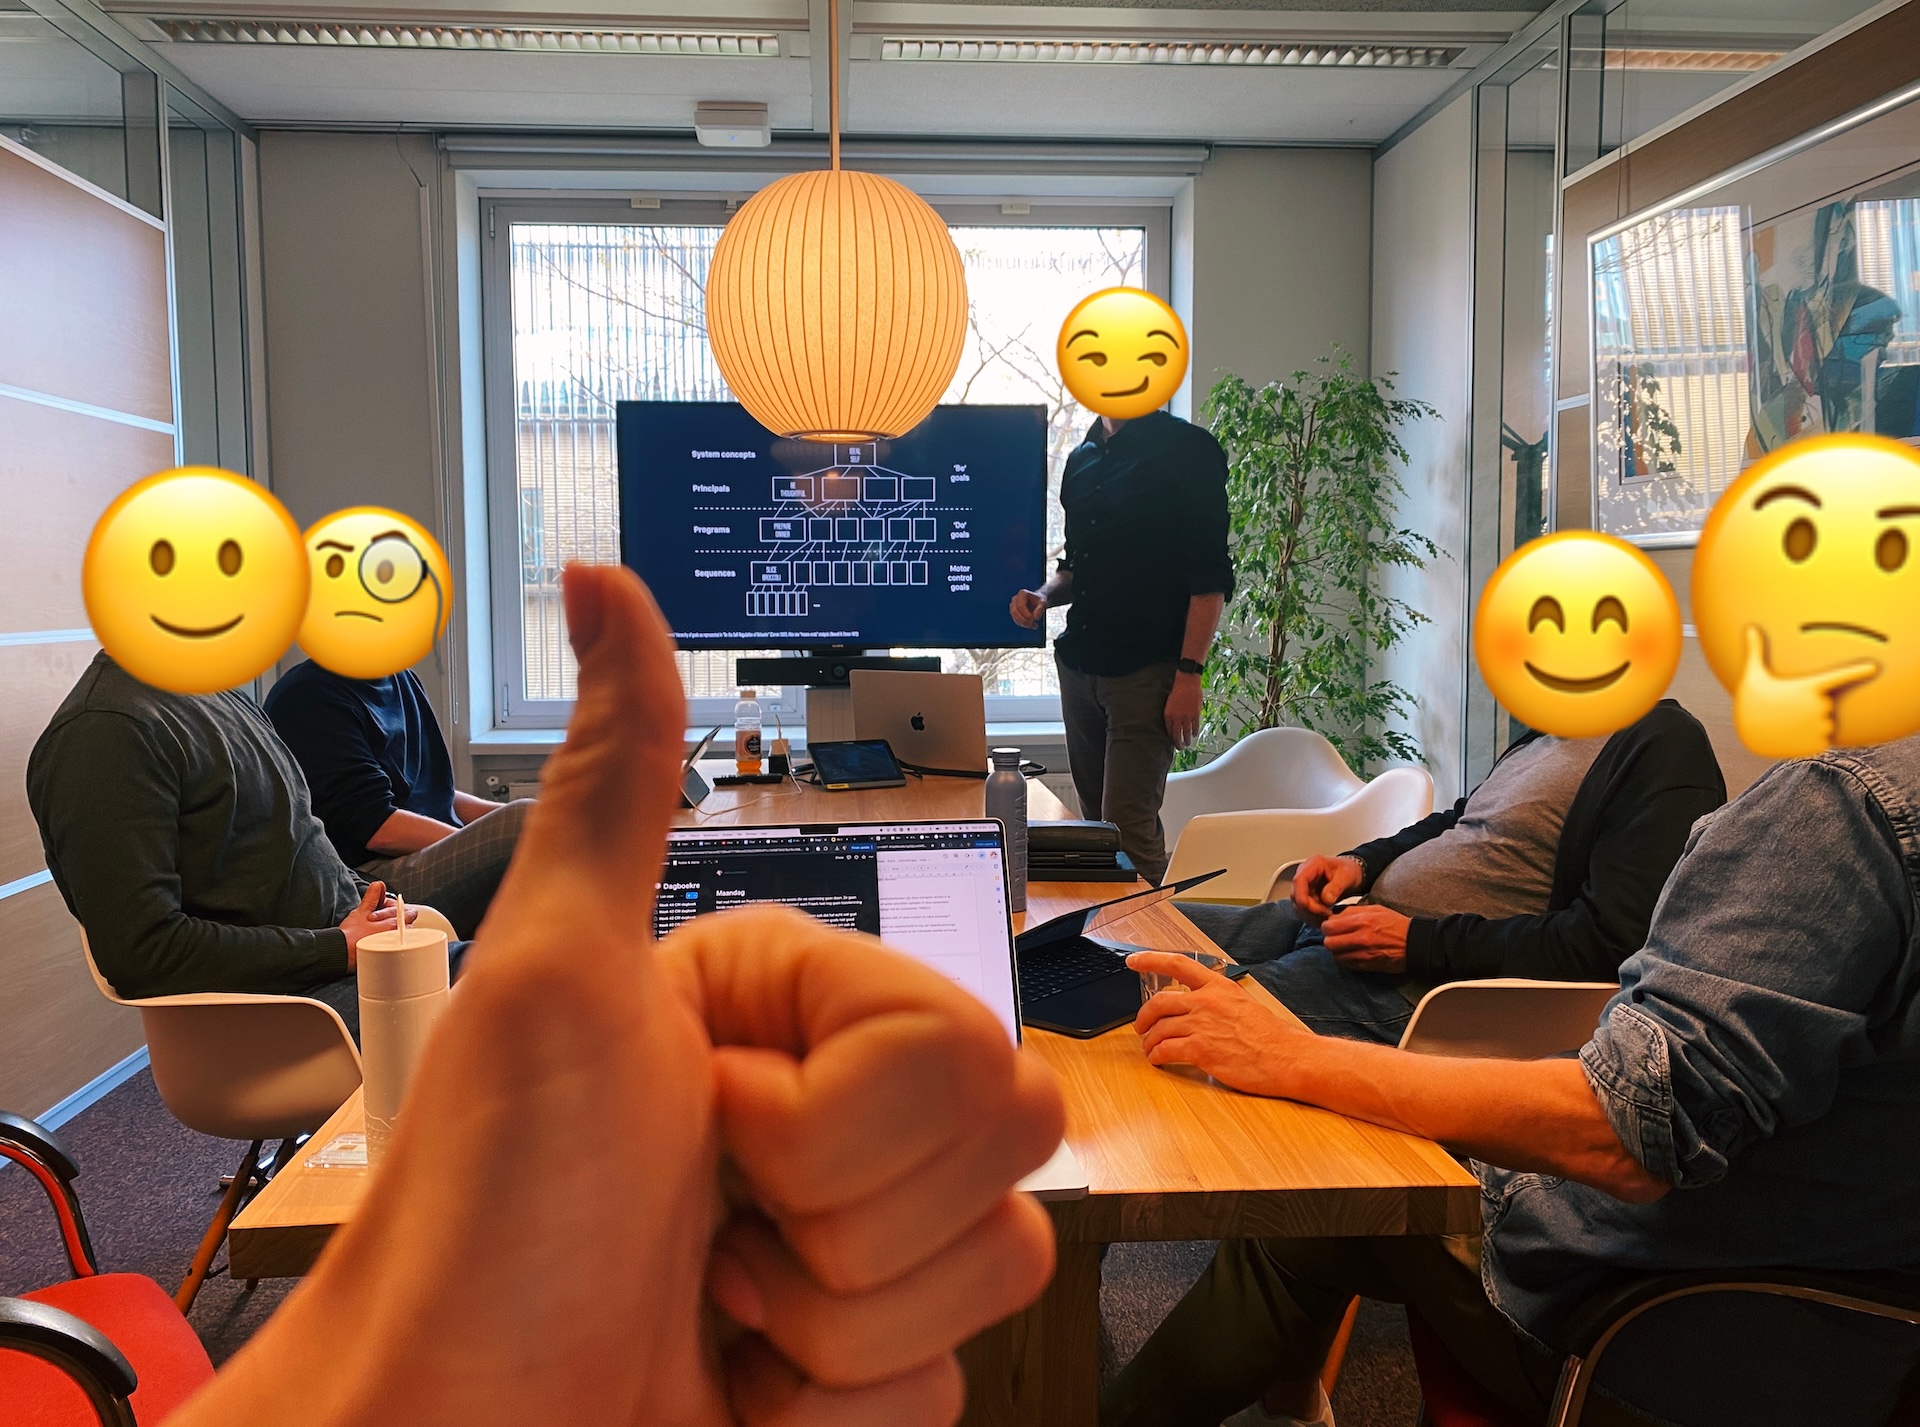
Despite that exception, make the Ph.D. student a 100% part of the team. Invite them to after-work drinks, the team party, and add them to the department’s contact list. First of all, it’s necessary to be able to conduct research from the inside out and thus gain full access. Colleagues are more open, willing to share information, and include PhD students when this sense of team spirit is present. It improves the research. But it’s also just nice. Without my teammates at CRI, I would have thrown my laptop out the window long ago.
I hope the government will create many more places like this. There is still so much to explore and learn. And it is precisely by not keeping that knowledge within organizations but sharing it with the scientific community that we can all benefit from it.
Continue reading?
- I wrote a detailed recap of Year 1 and Year 2. The recap of Year 3 will be coming in December.
- You can read about how I apply action research in my research in these blog posts: “Open Action Research ” and “Practical Case Study.”
- How I Set Up My Ph.D. Research in Collaboration with DUO from the Very Beginning: The Journey So Far.